Improvements in cancer waiting times
Summary
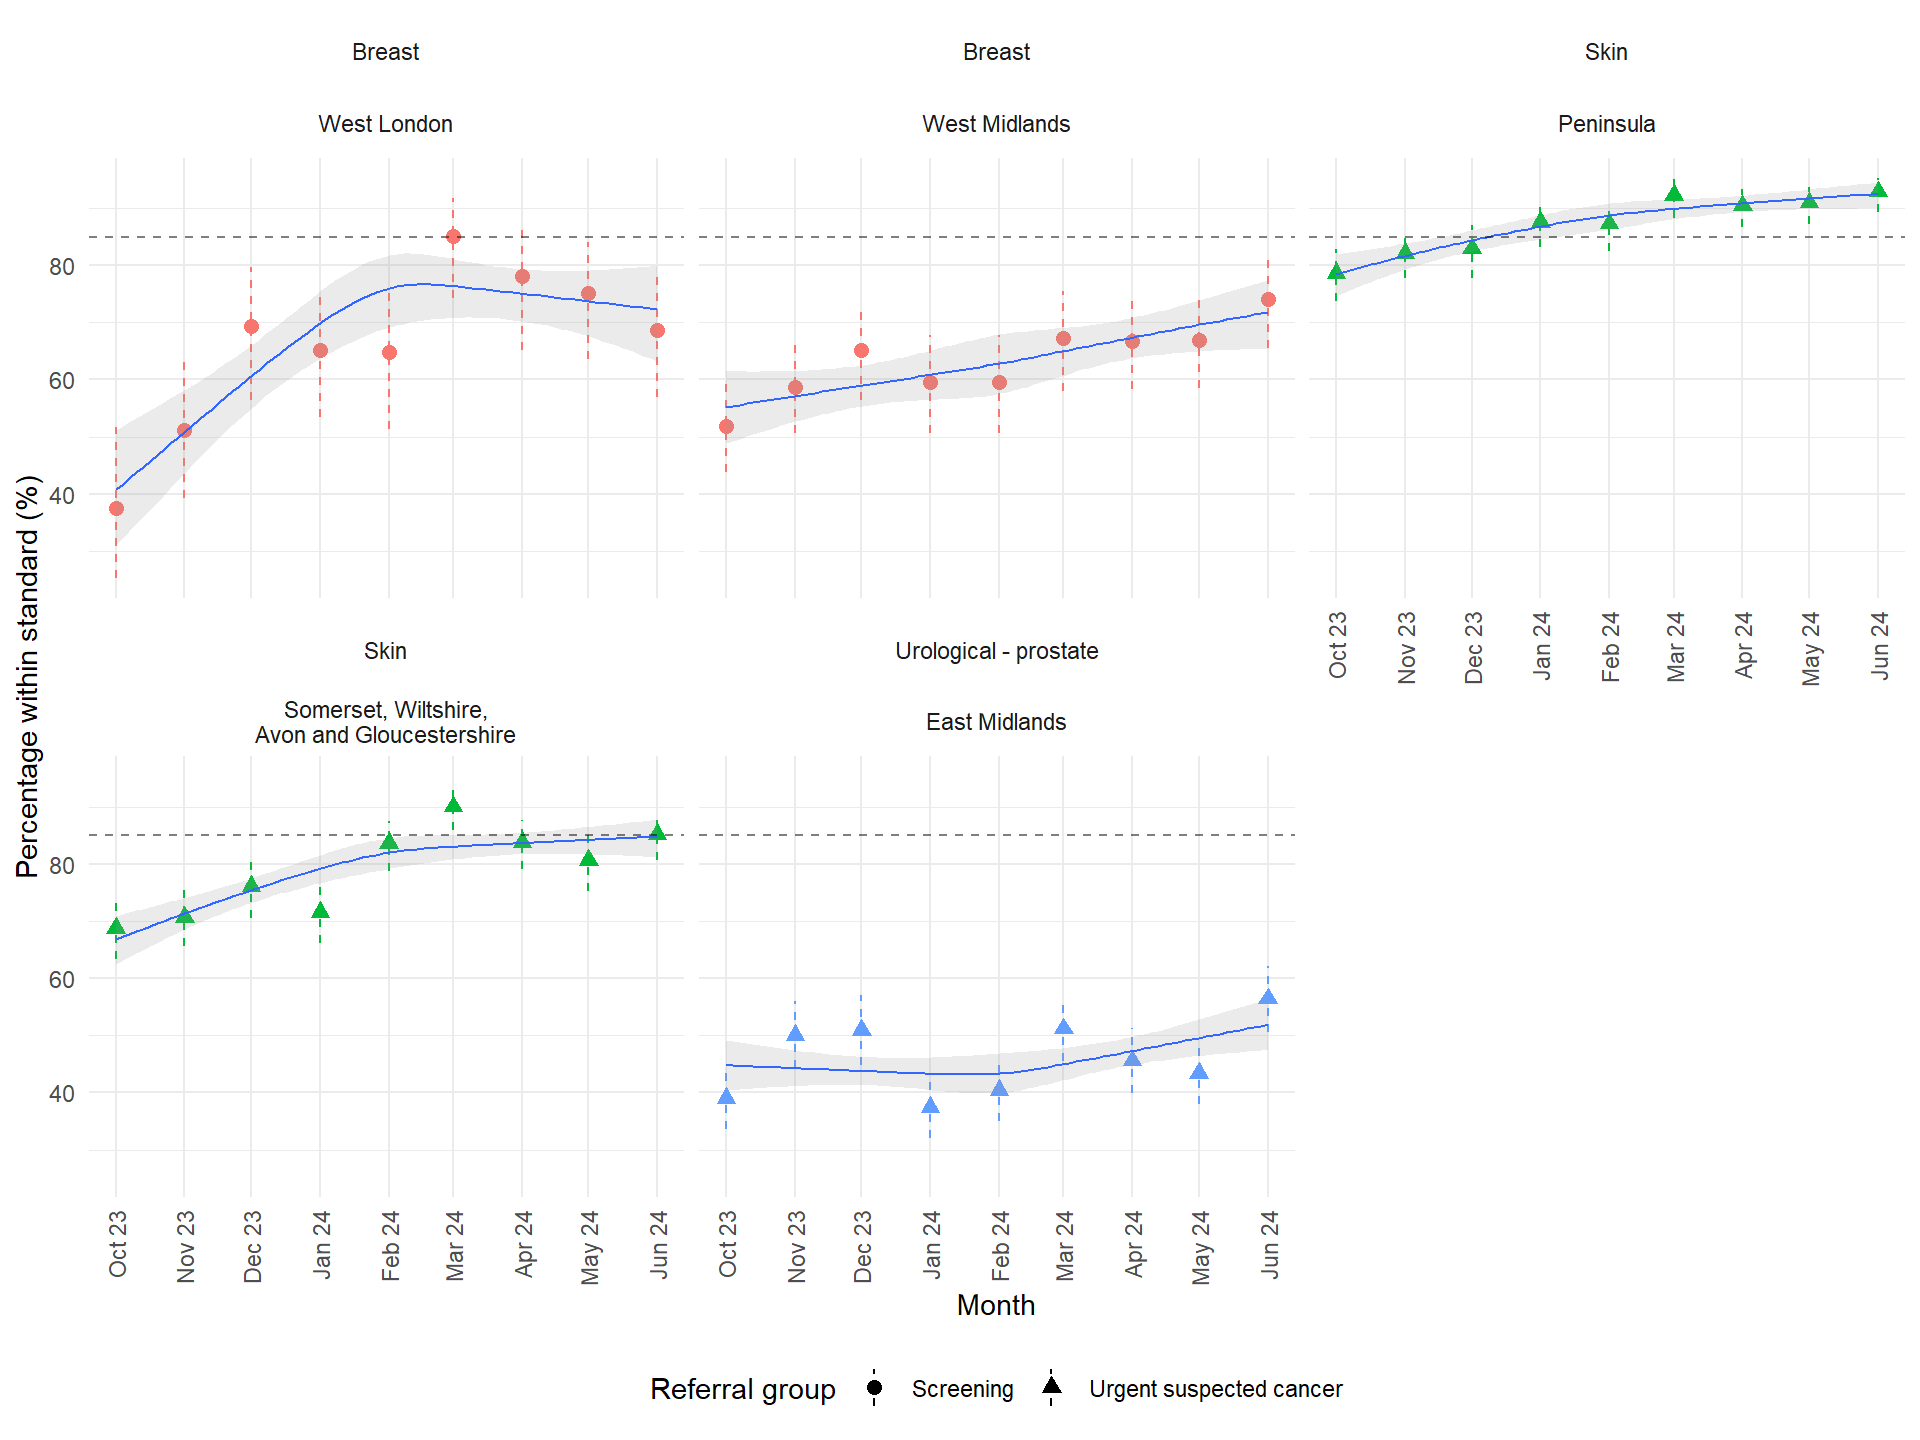
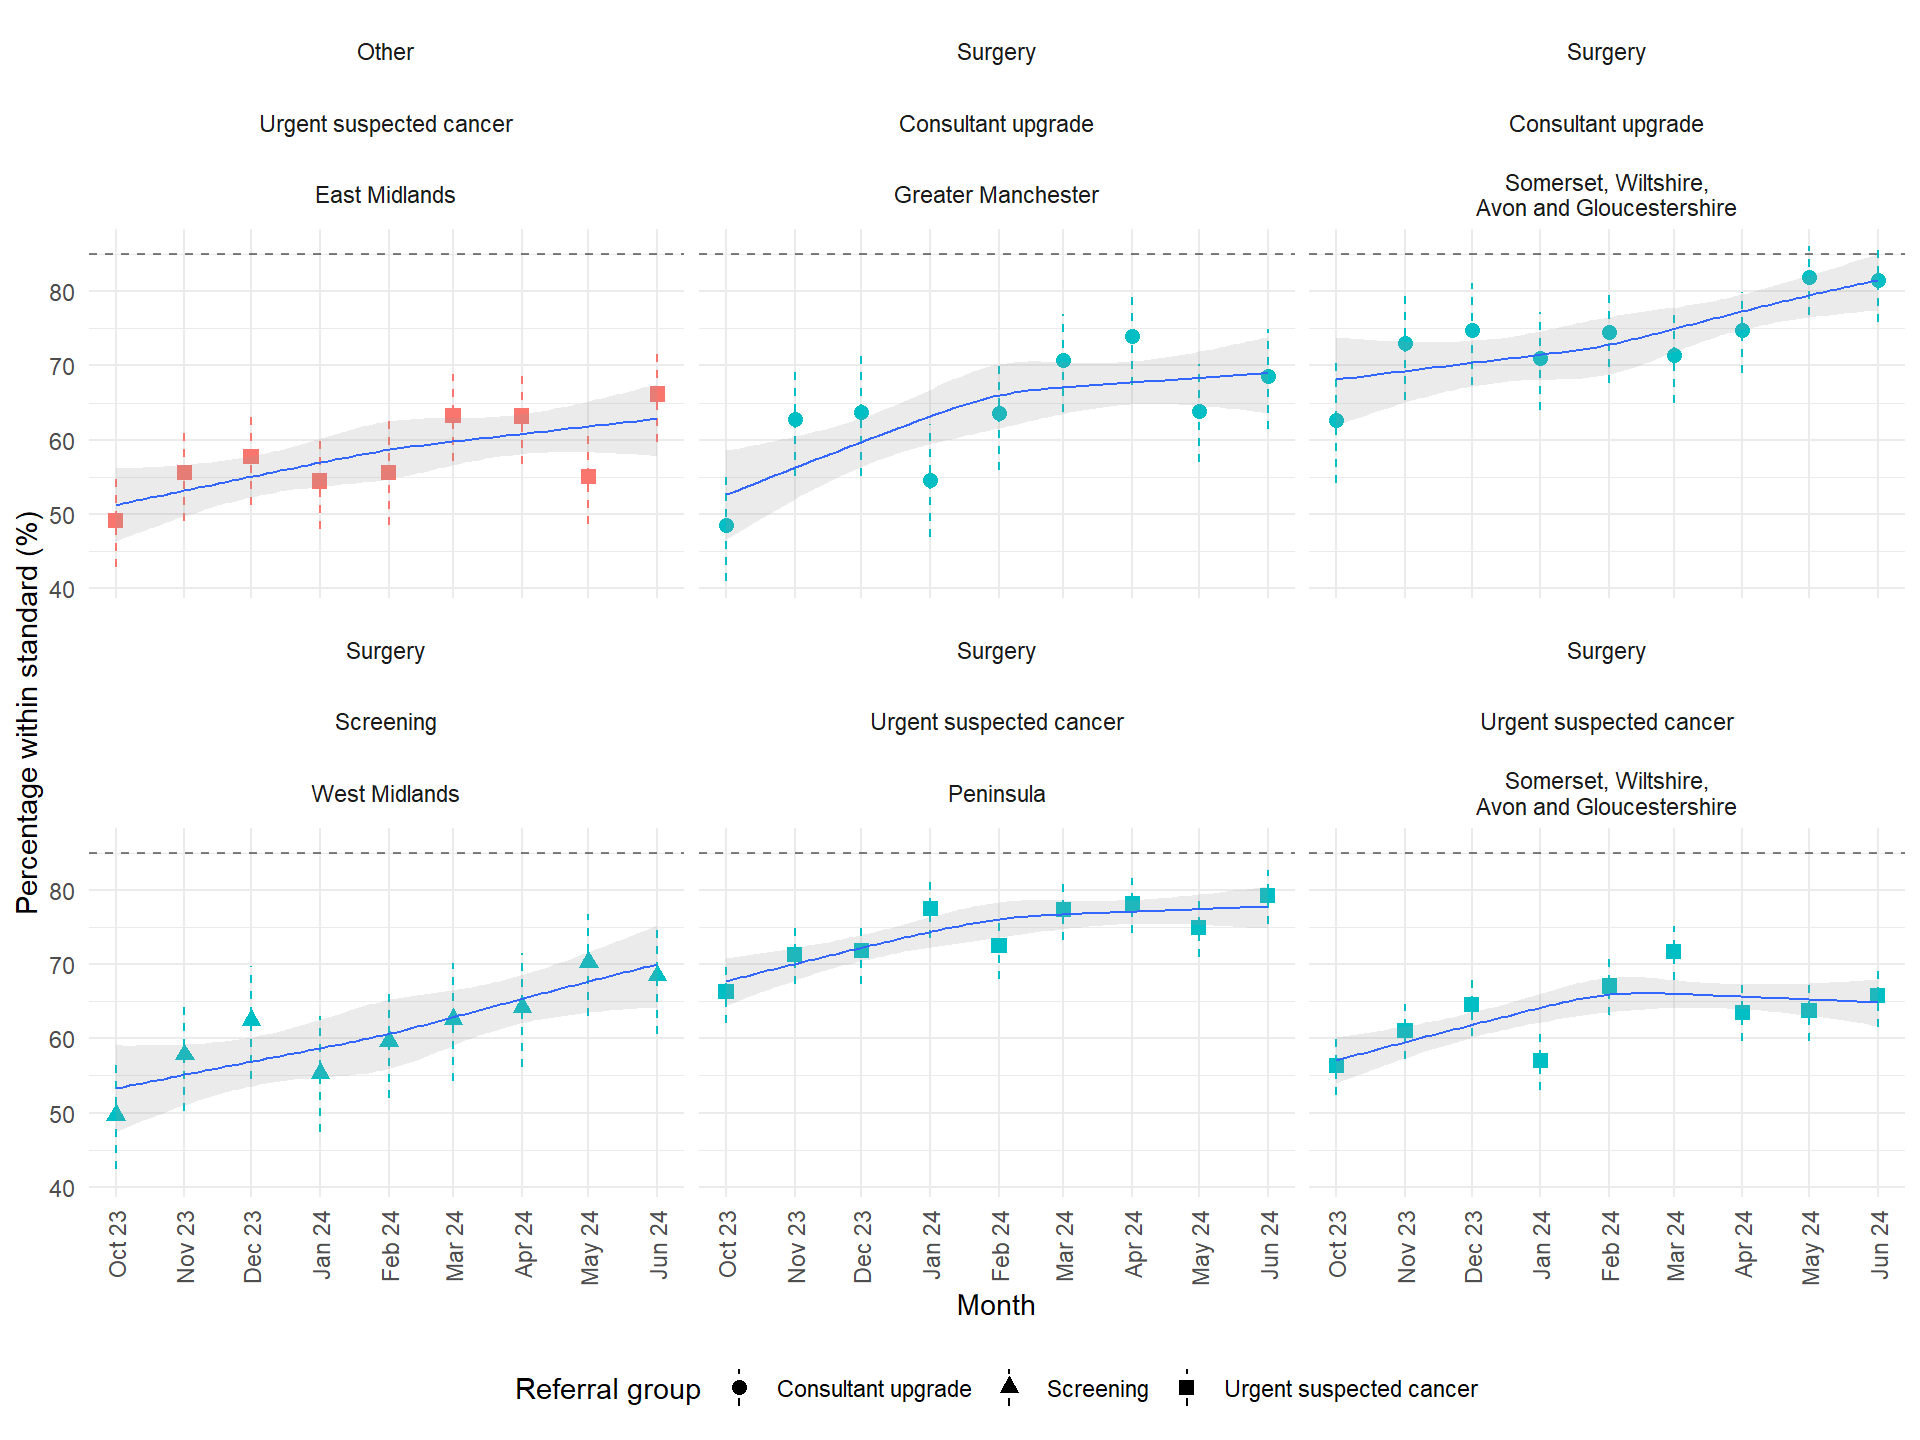
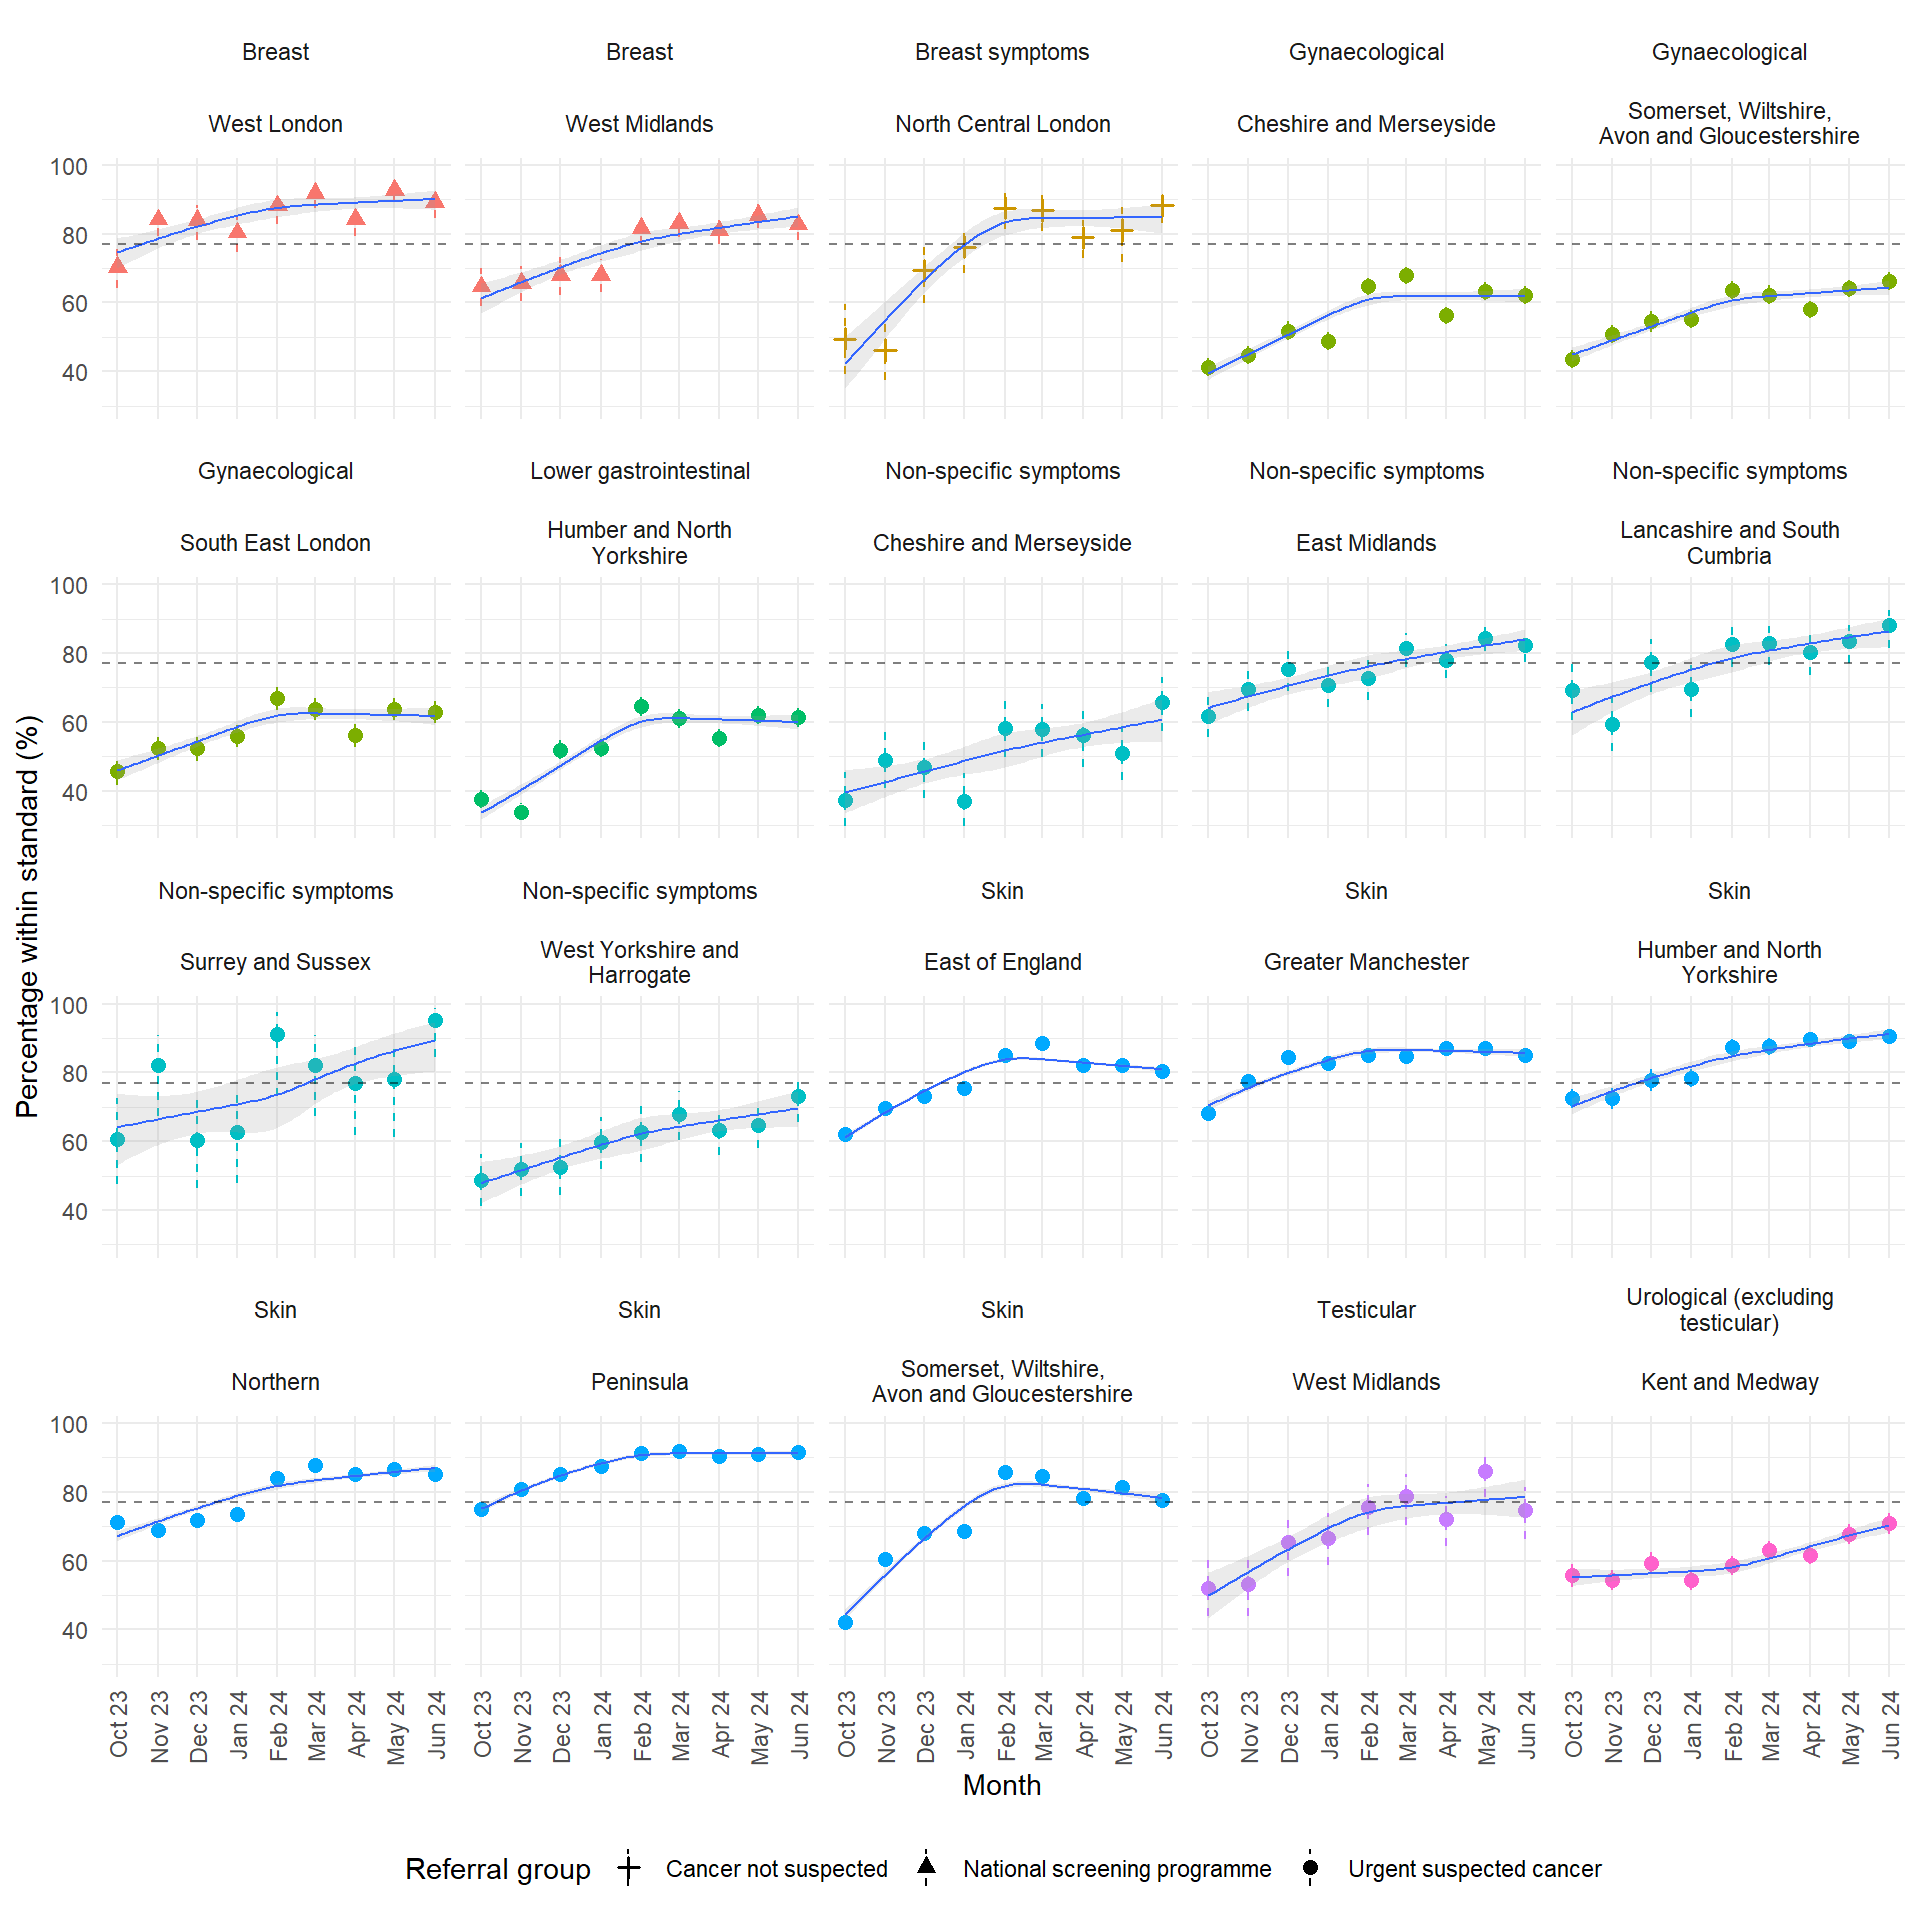
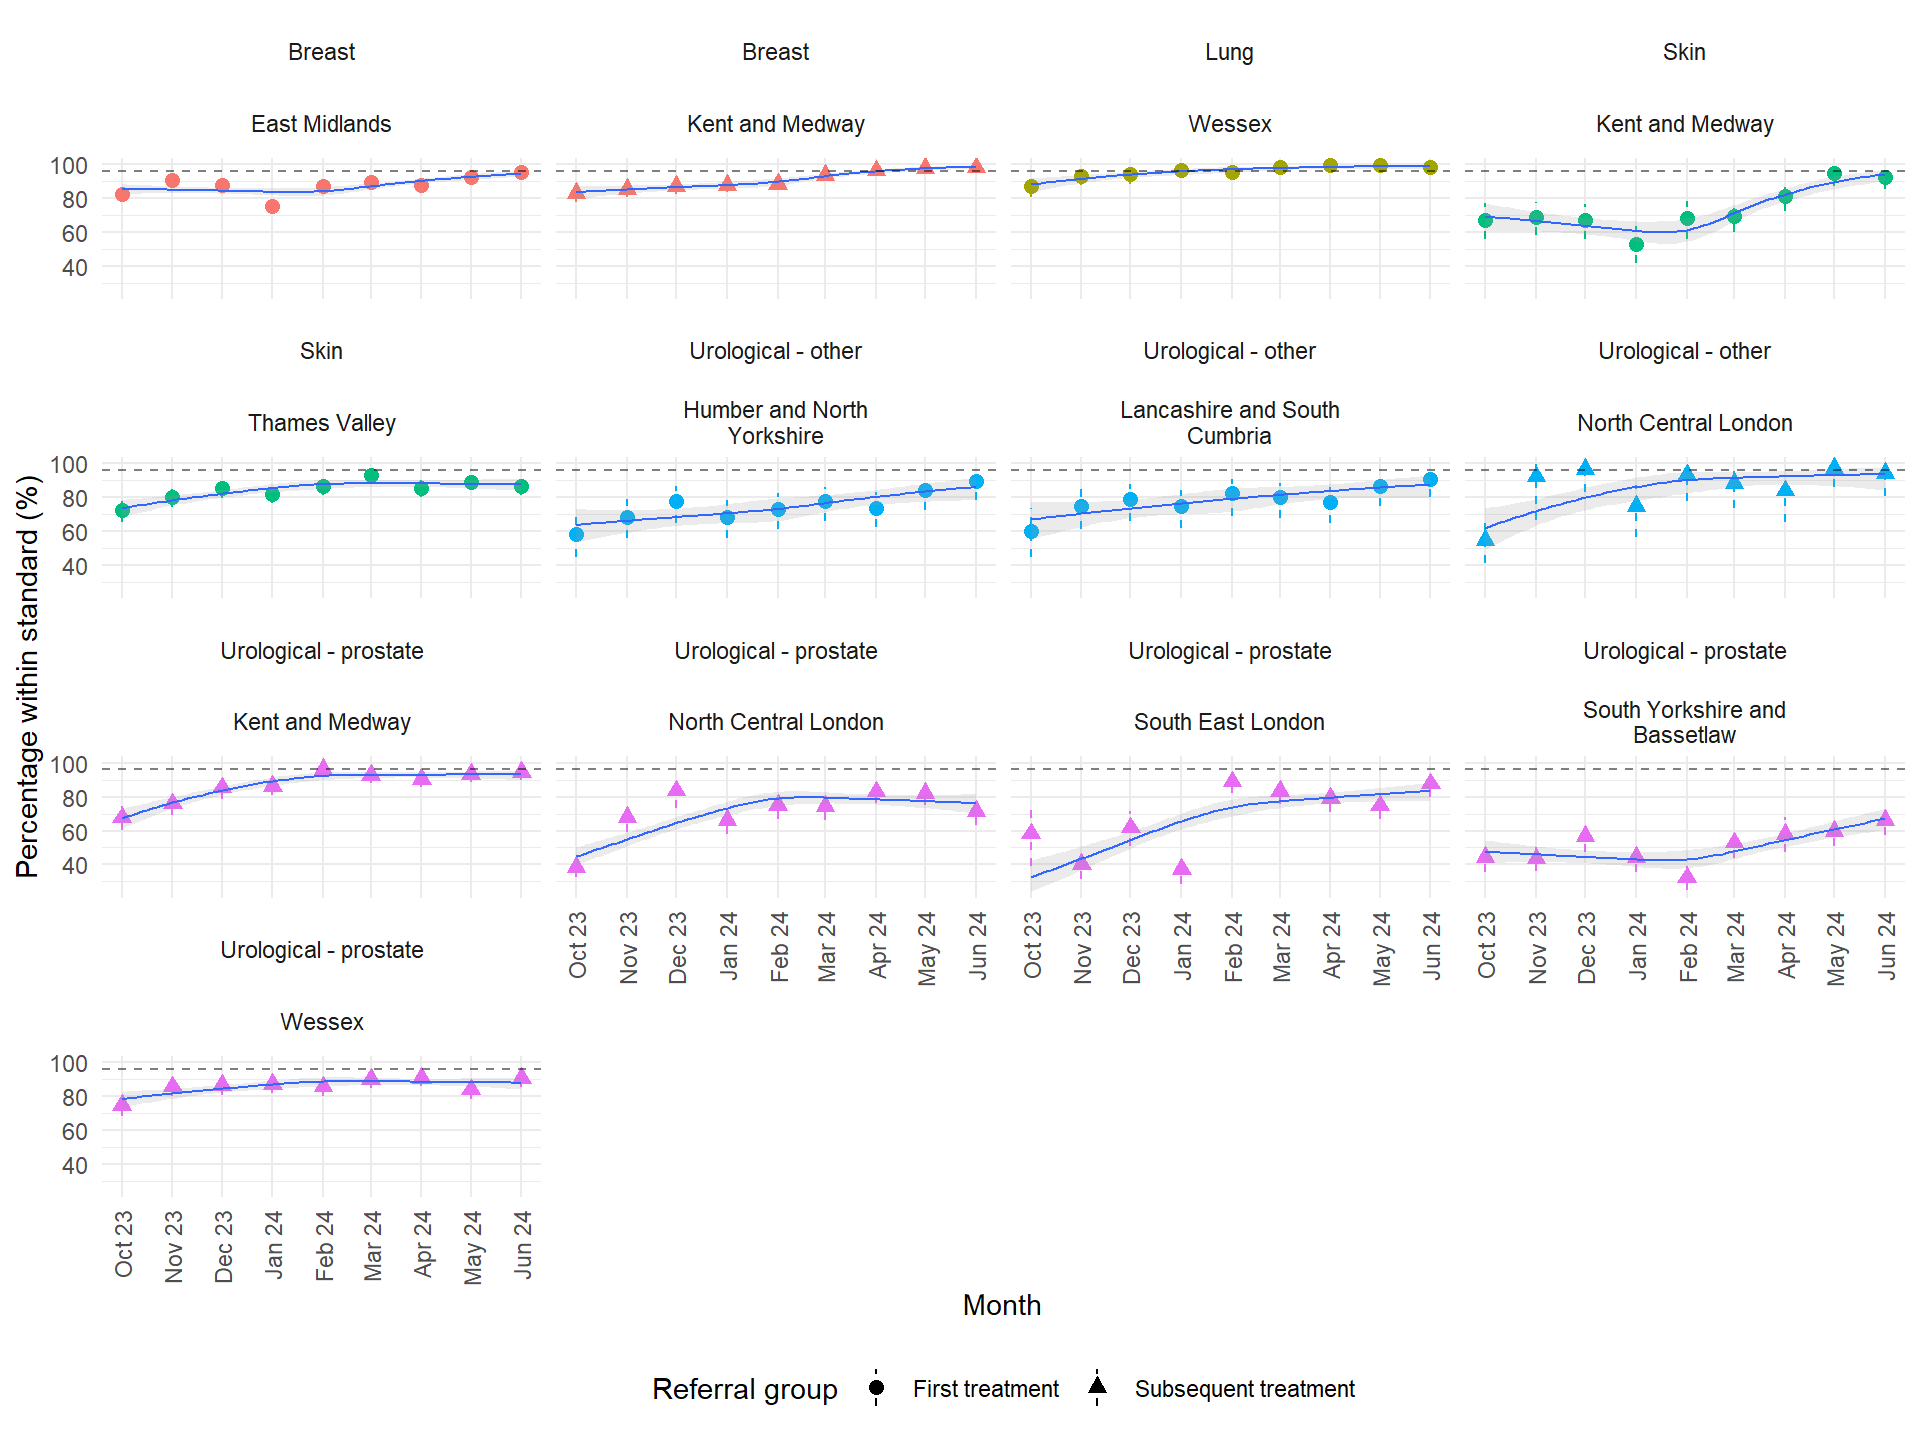
This page highlights improvements in performance on cancer waiting times, by standard, Cancer Alliance, and pathway. The examples shown increased the percentage of patients within standard by at least 5 percentage points over the time period (with p-values less than 0.001). For each standard, the pathways with the greatest percentage point increases are shown (with a maximum of 20 examples).
28-day Faster Diagnosis Standard
31-day treatment standard
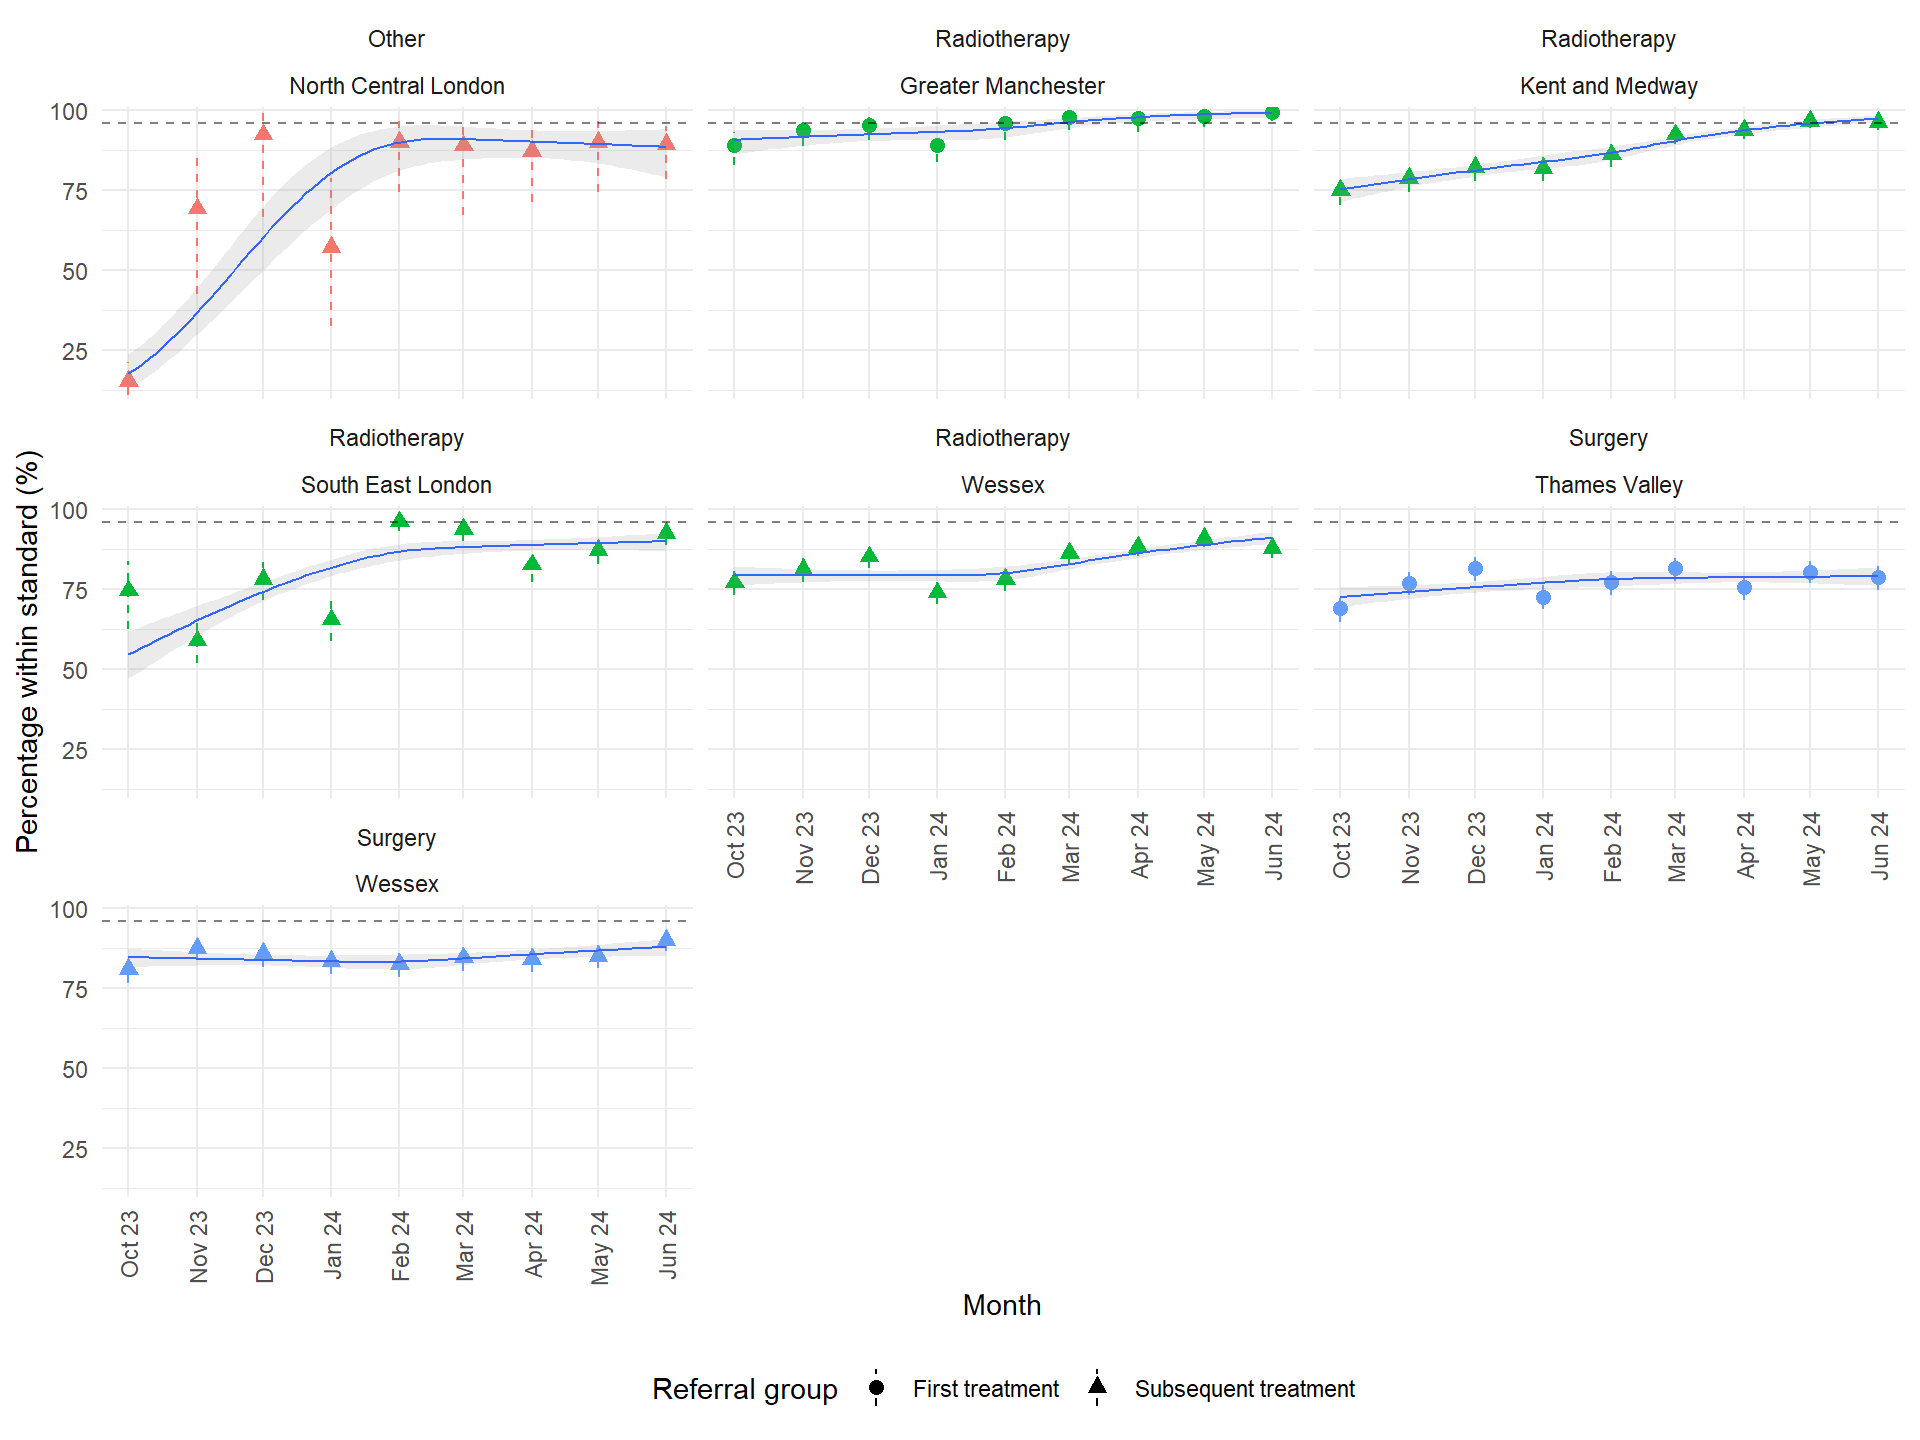
62-day treatment standard