| Standard | Percentage within standard (%) | Total number of patients | Total number within standard | Total number of breaches |
|---|---|---|---|---|
| 28-day Faster Diagnosis Standard | 75.4 | 4524661 | 3409673 | 1114988 |
| 31-day treatment standard | 90.7 | 1871678 | 1696844 | 174834 |
| 62-day treatment standard | 67.1 | 908357 | 609289 | 299068 |
National performance and regional variation
Summary
This page shows the percentages of patients within waiting times standards, nationally and by Cancer Alliance. Performance is often below the national objectives for each standard, with variation between regions.
Time period of data: October 2023 to February 2025
National performance
Cancer Alliances
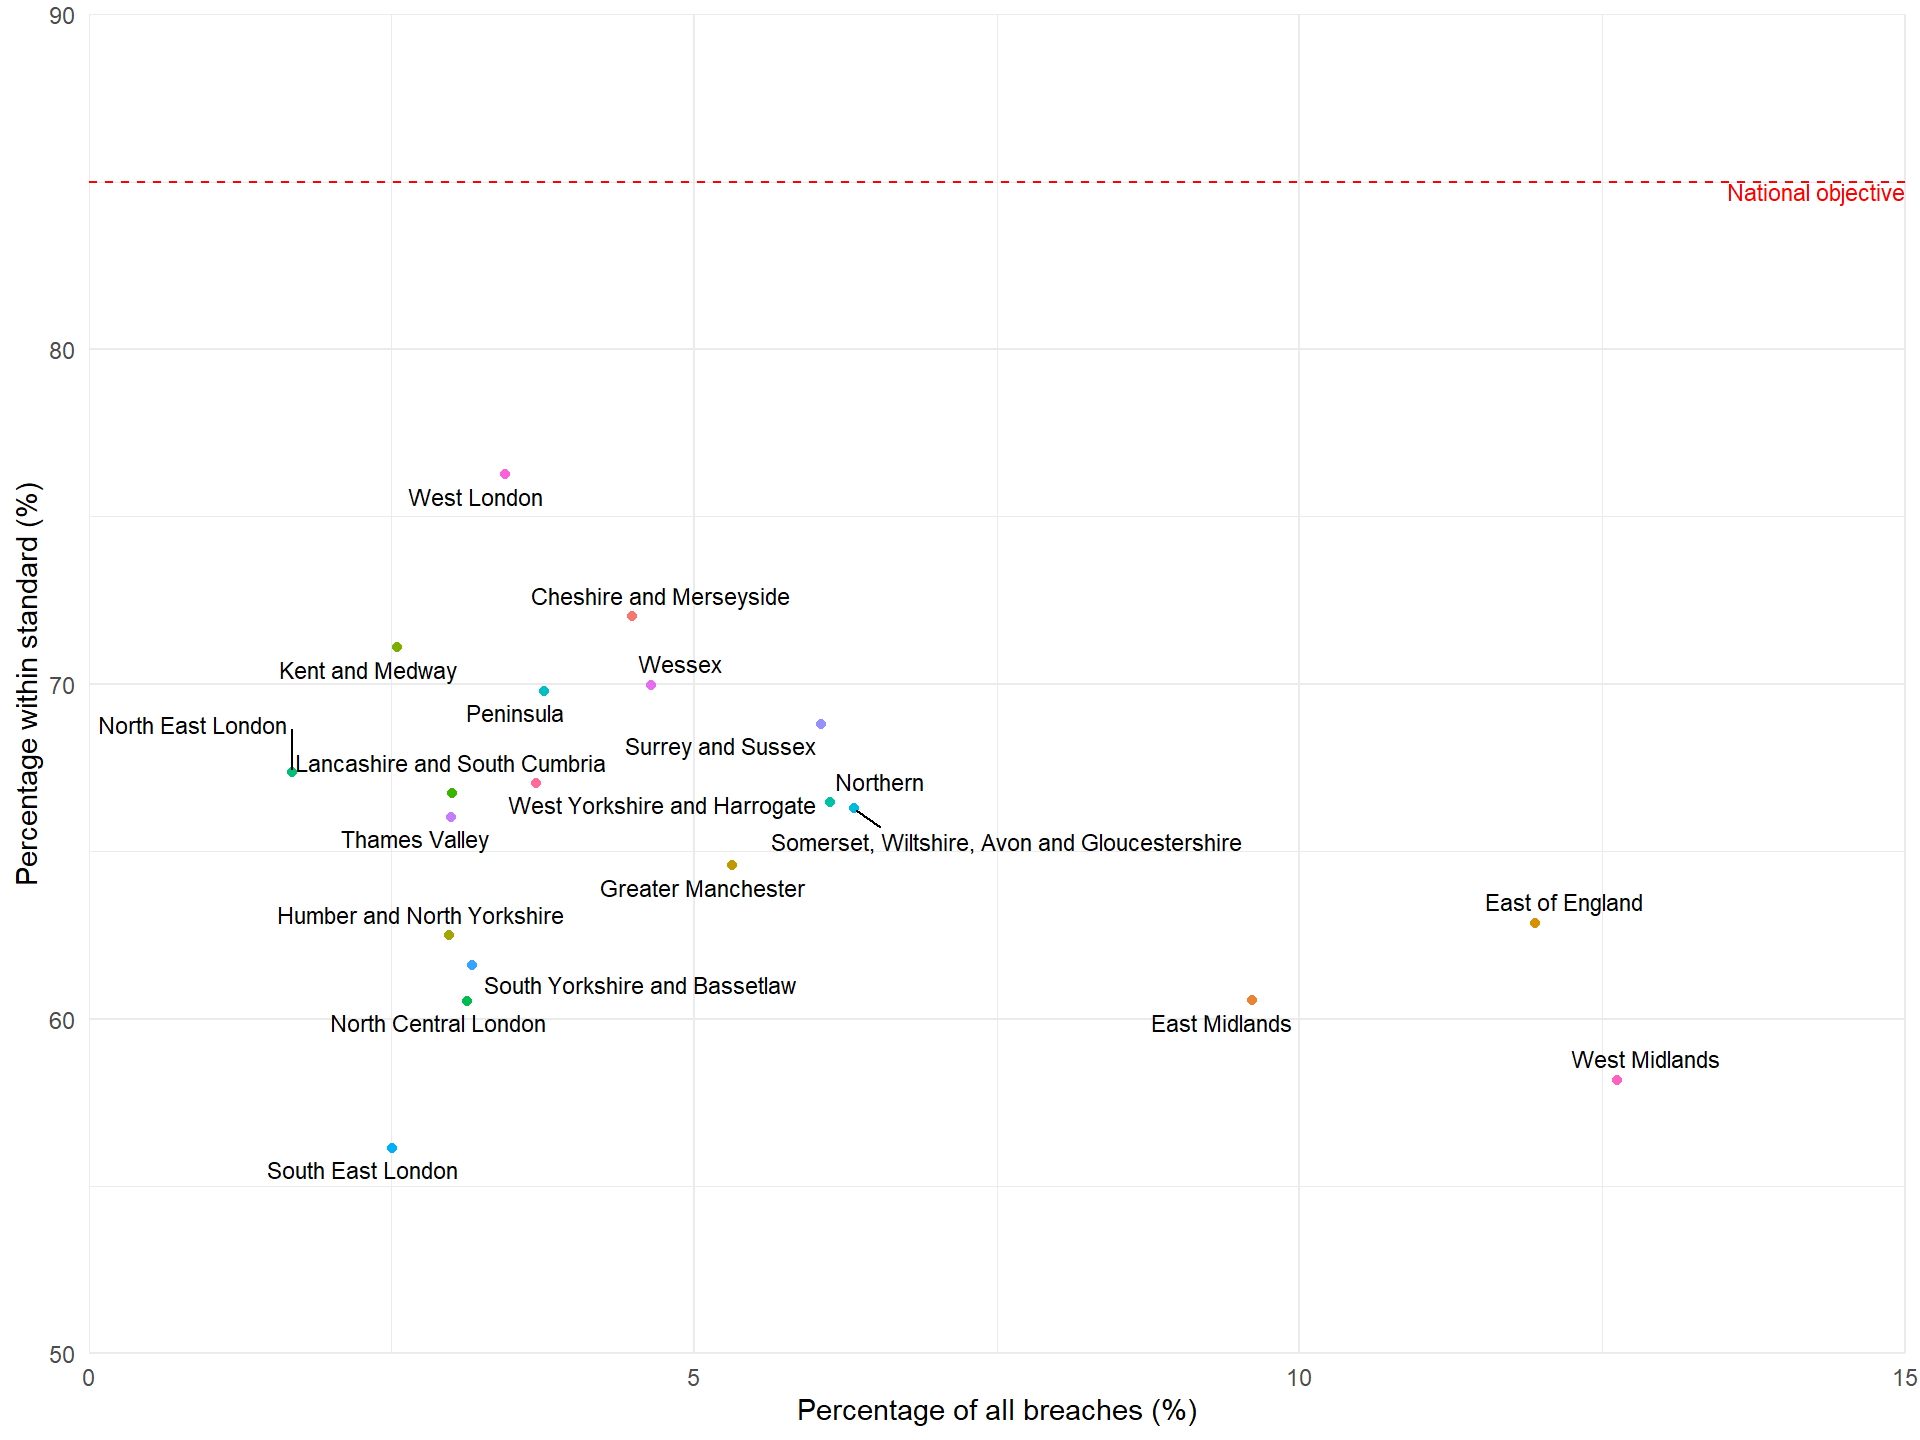
The figures below are scatter plots of Cancer Alliances, by standard:
Y-axis - the percentage of patients within the standard in each alliance.
X-axis - the percentage of all breaches of the standard (nationally) that are in each alliance. This equals the number of breaches in that alliance divided by the number of breaches nationally. Values therefore reflect the number of patients in each alliance as well as the percentage within standard.
28-day Faster Diagnosis Standard
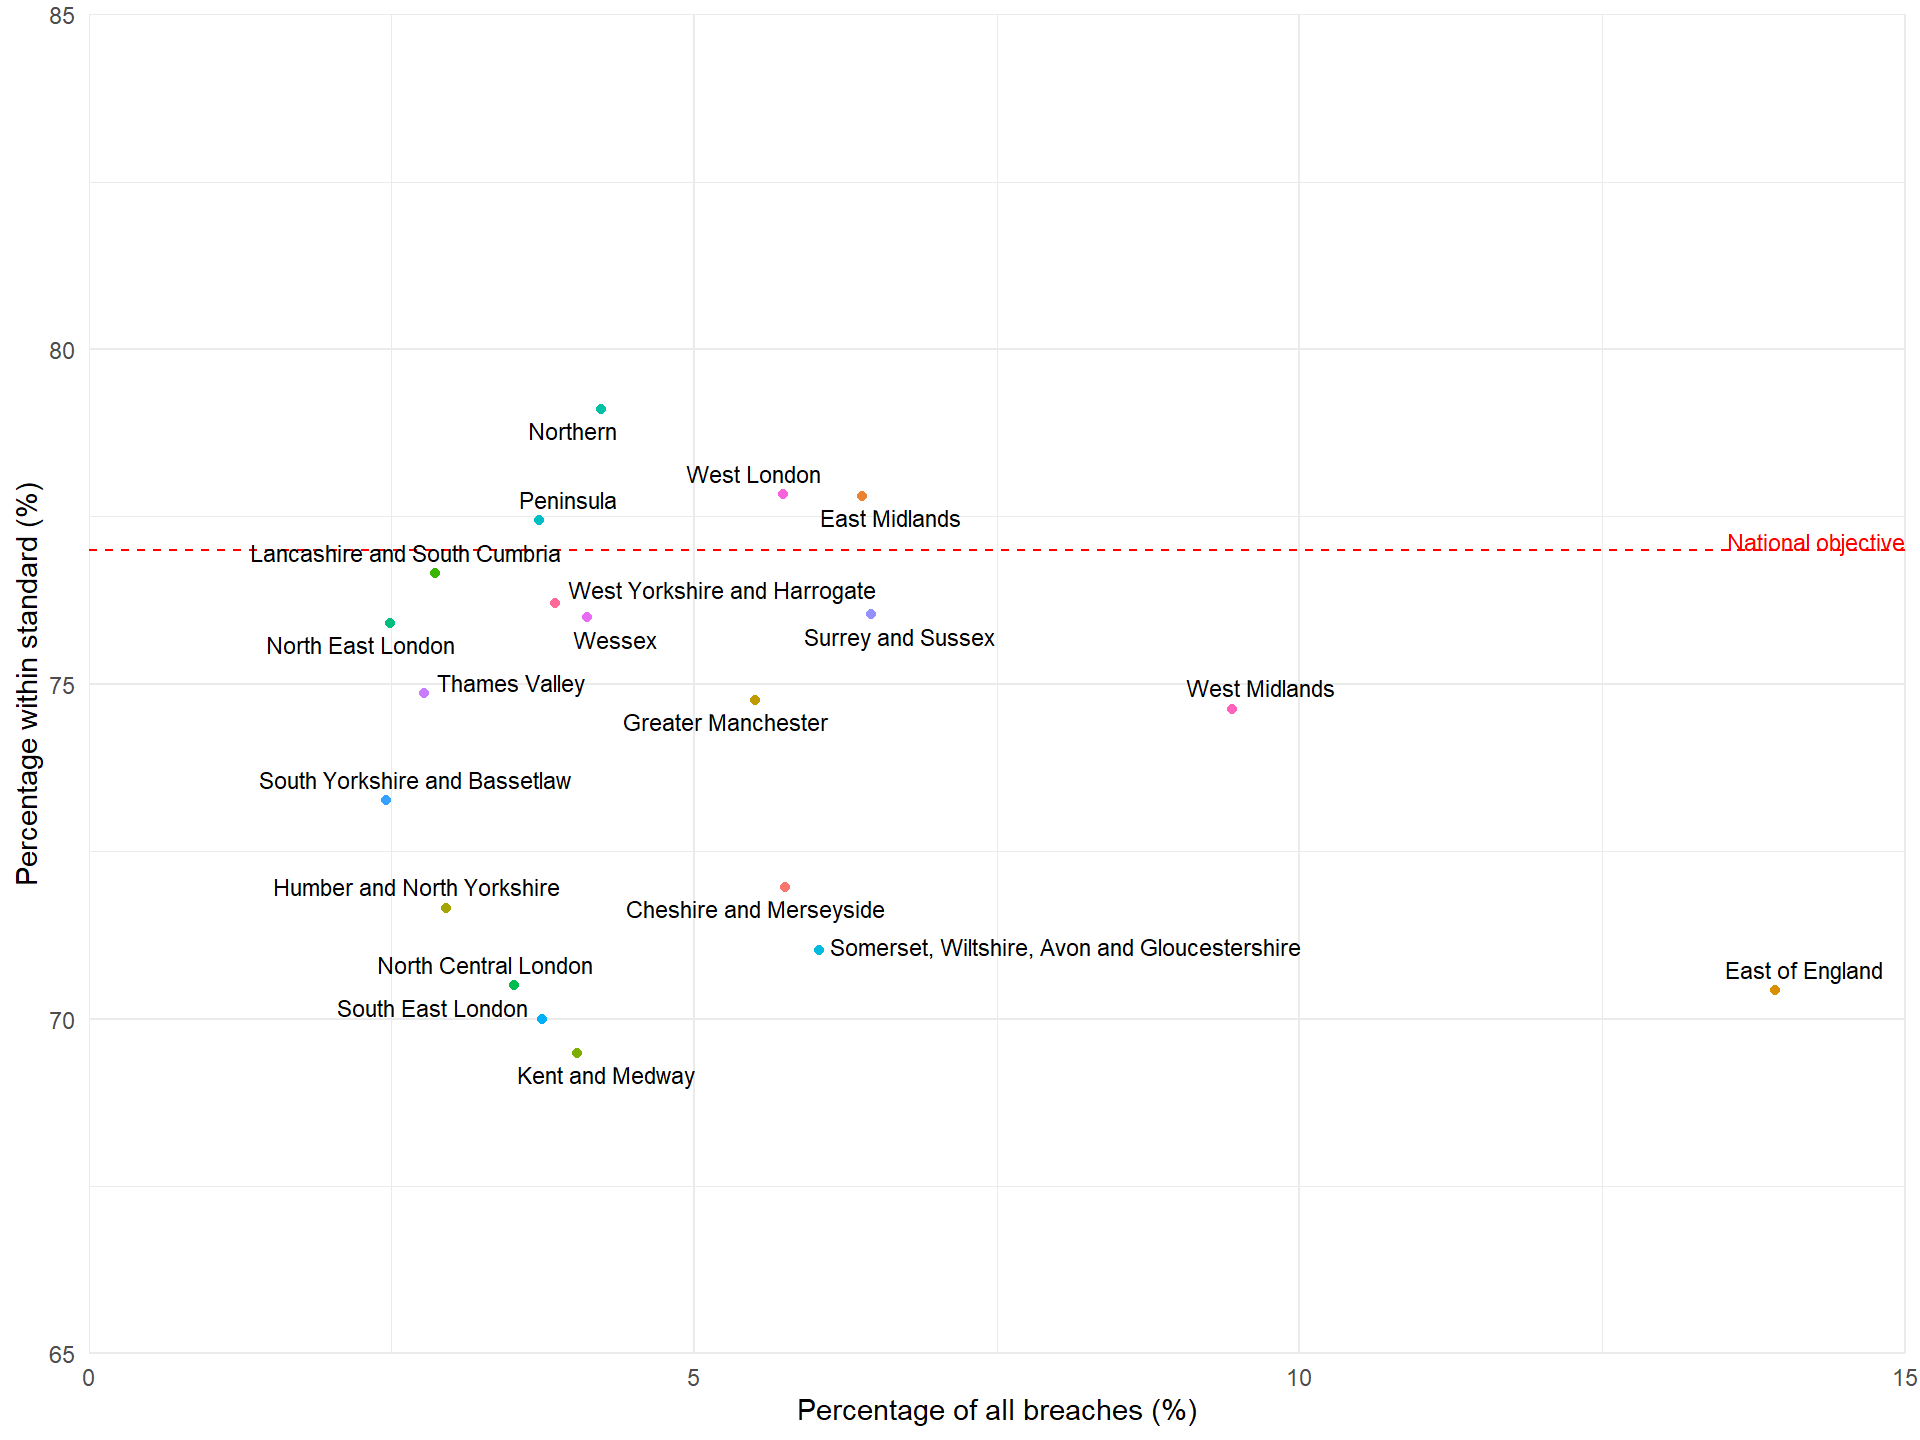
31-day treatment standard
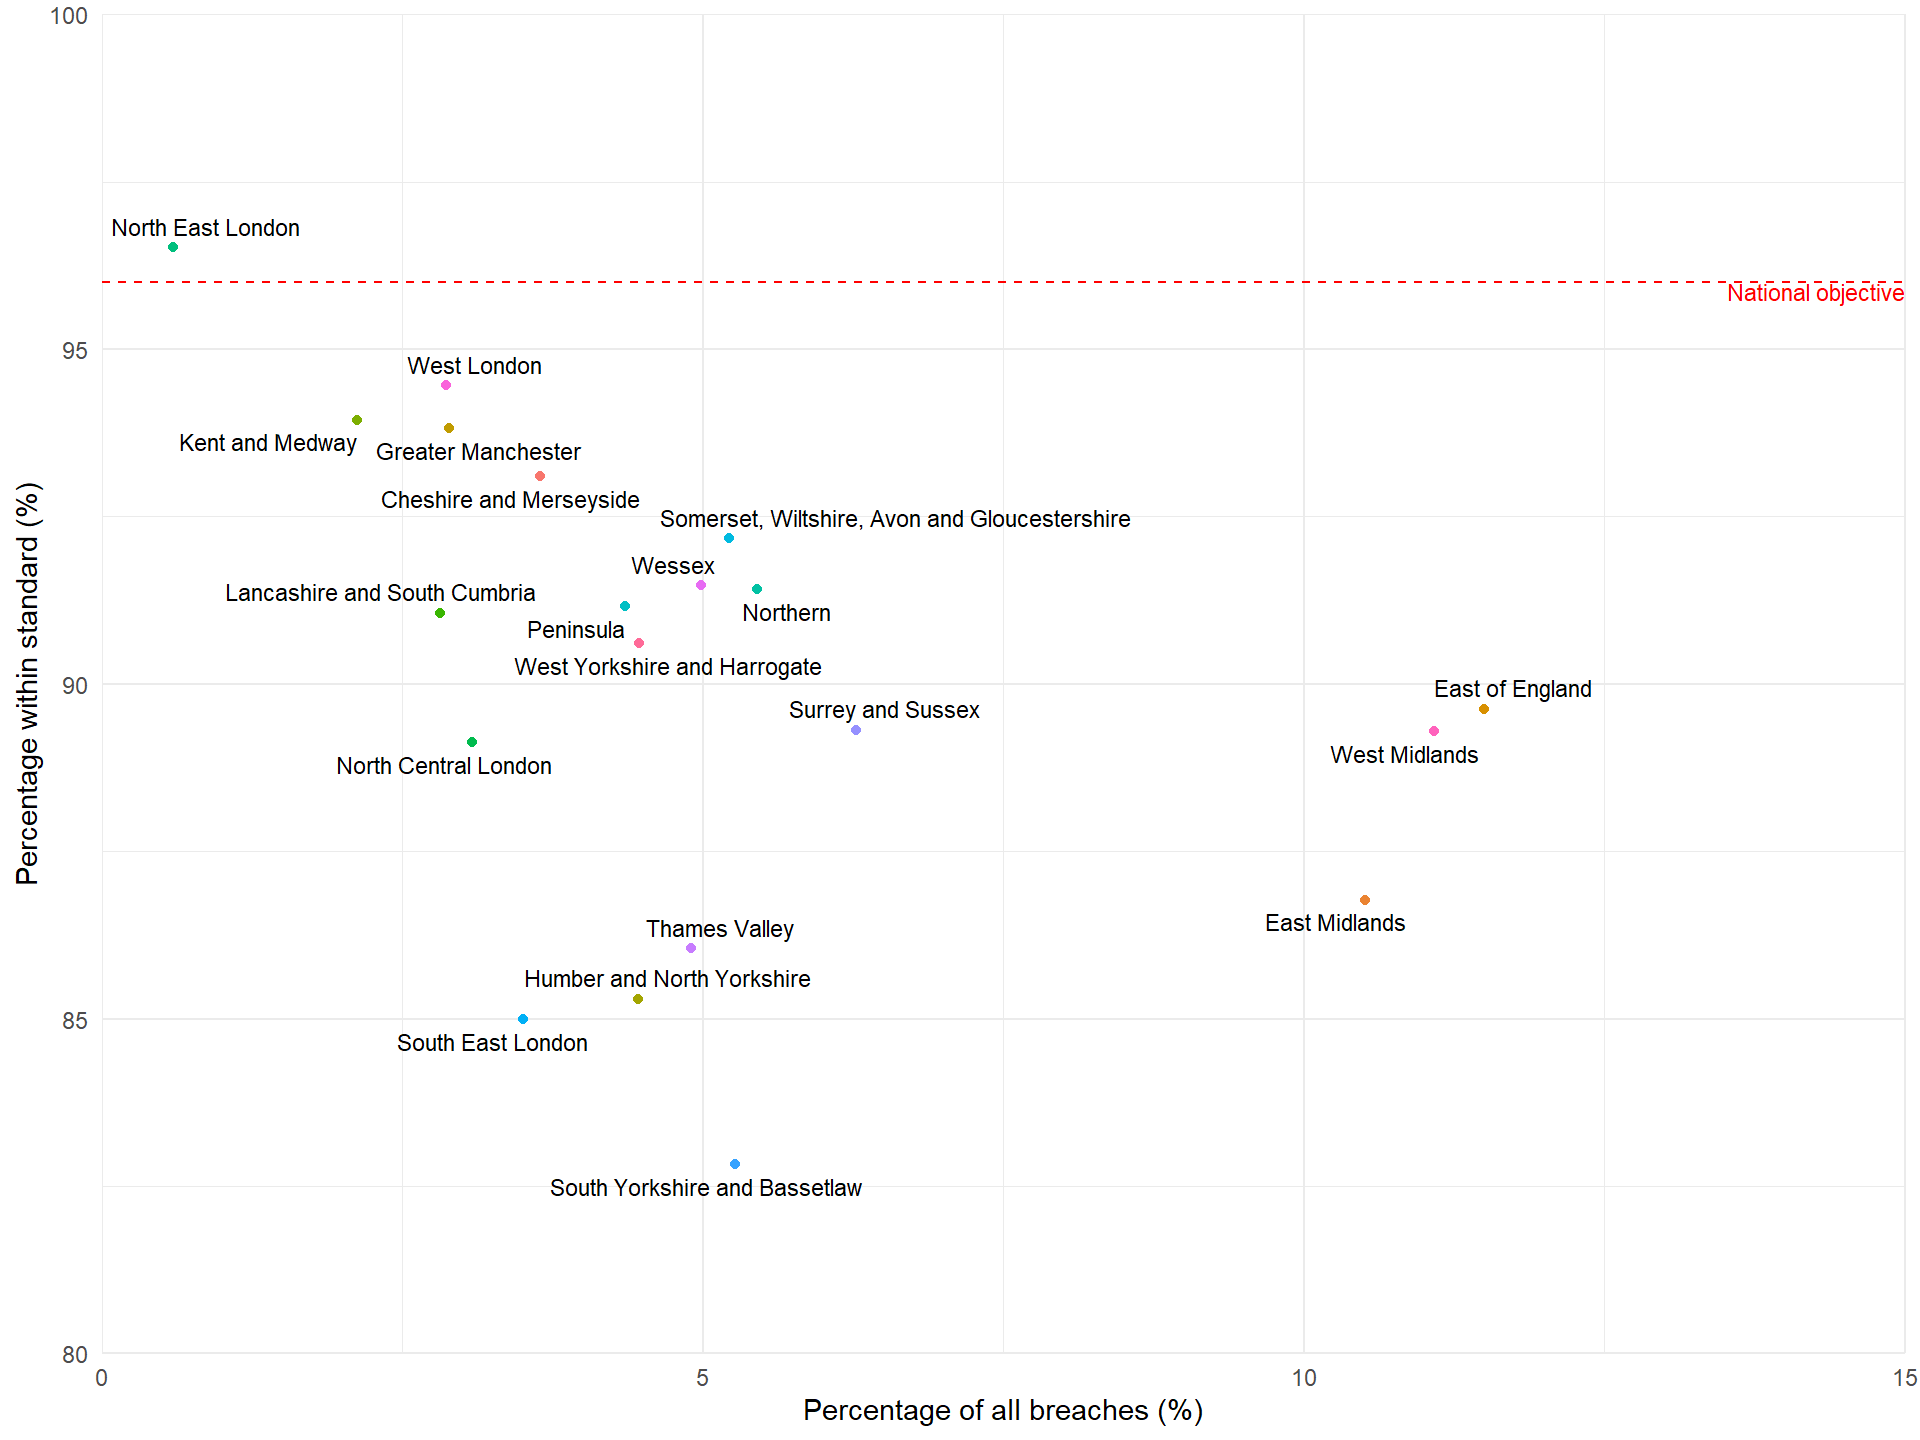
62-day treatment standard