This page shows time trends in the percentages of patients within waiting times standards (by cancer type, treatment modality, and referral or treatment pathway) since October 2023.
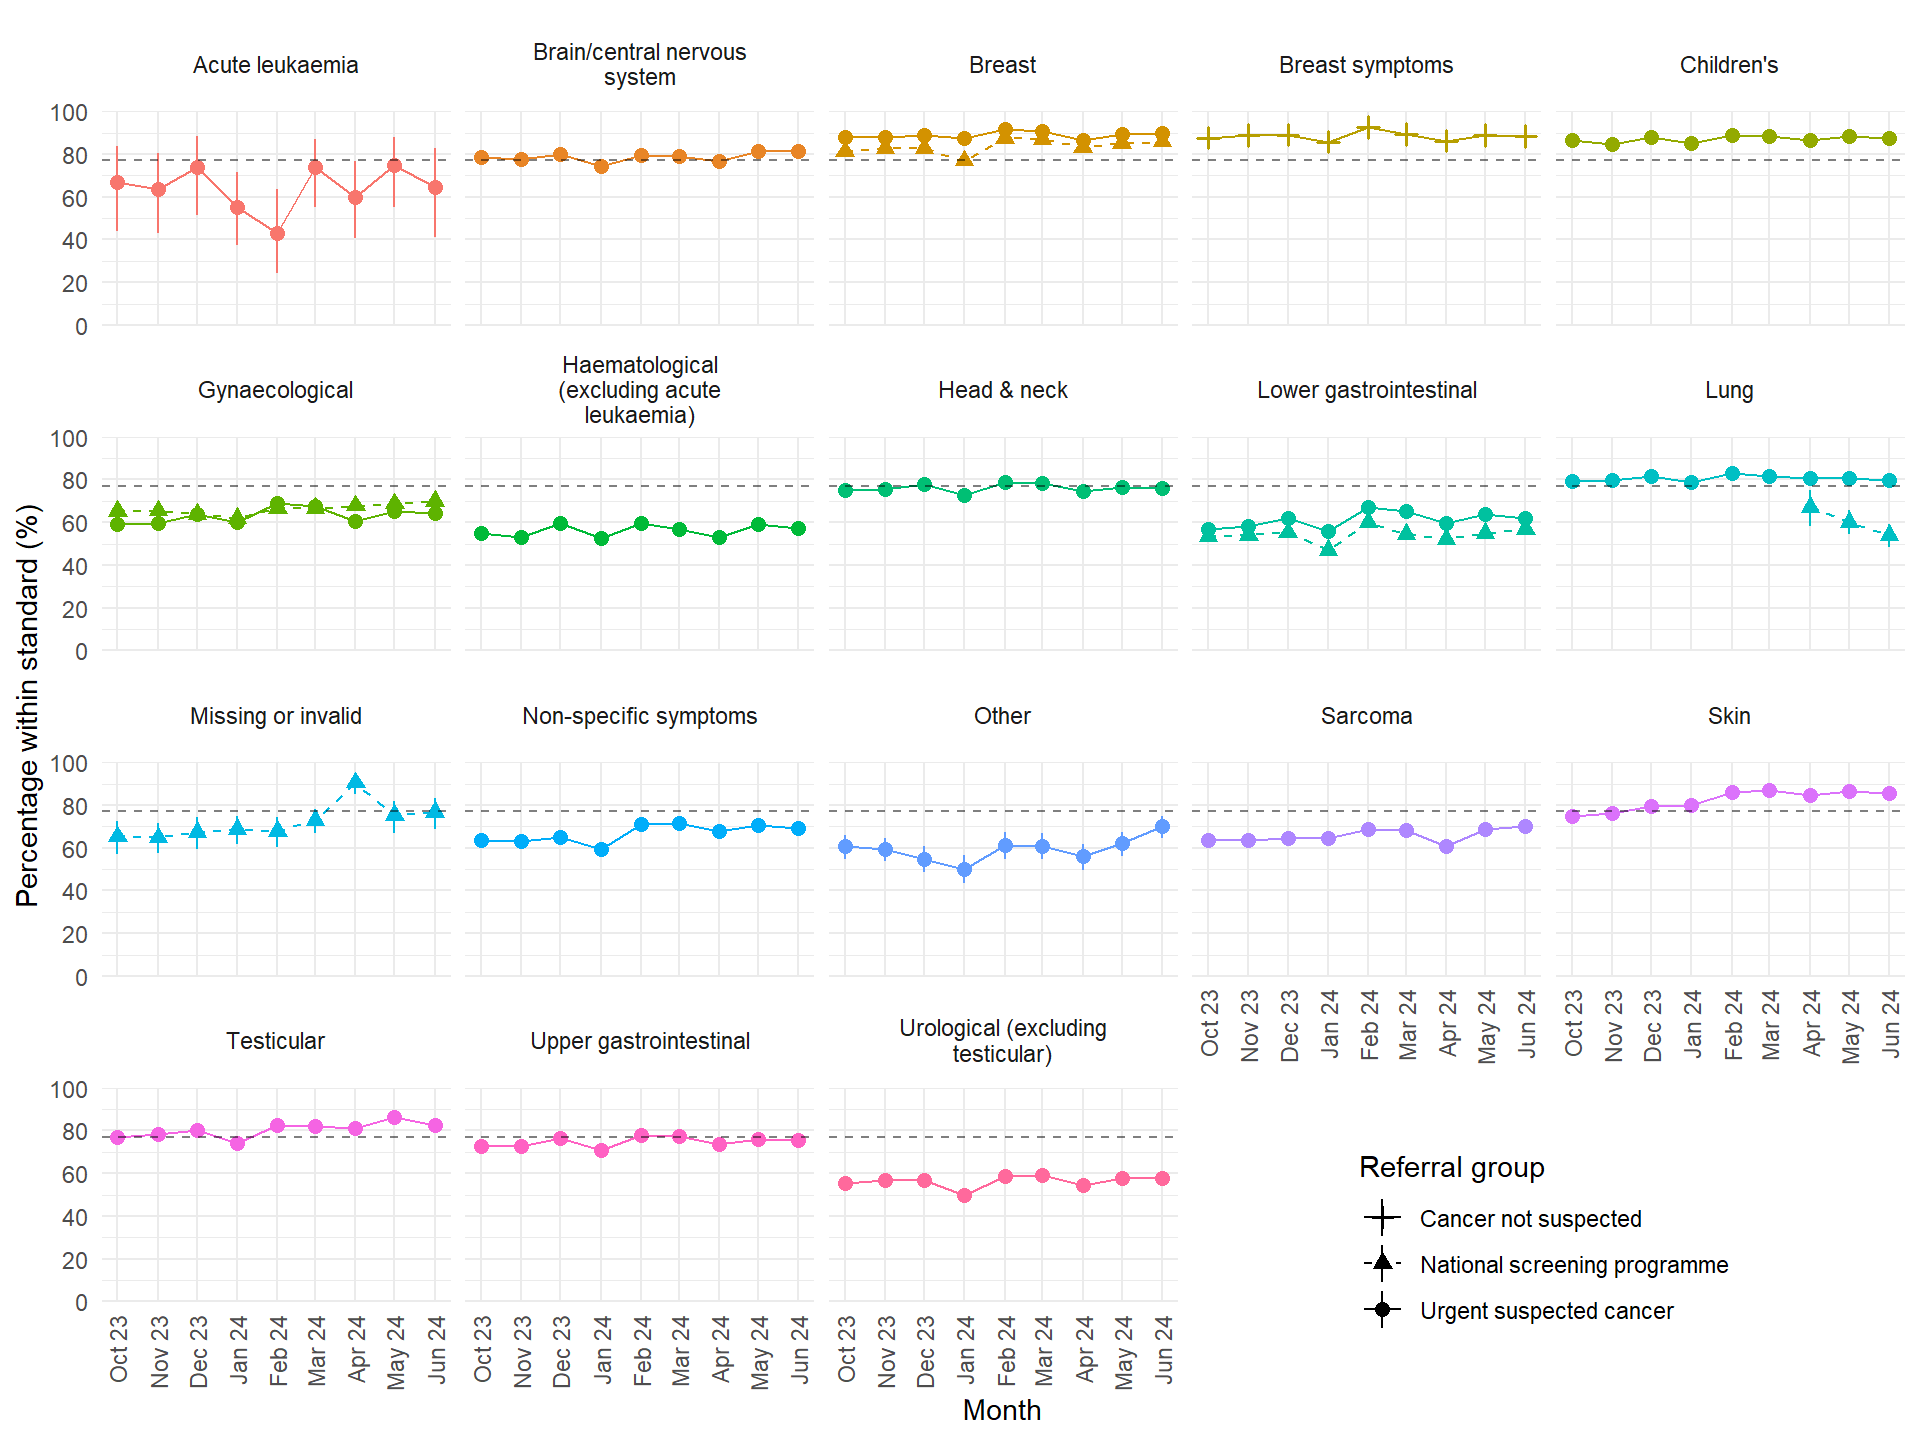
Figure 1: 28-day Faster Diagnosis Standard - Percentage of patients within standard (and 95% confidence intervals) over time, by cancer type and referral group. The dashed line at 80% indicates the national objective.
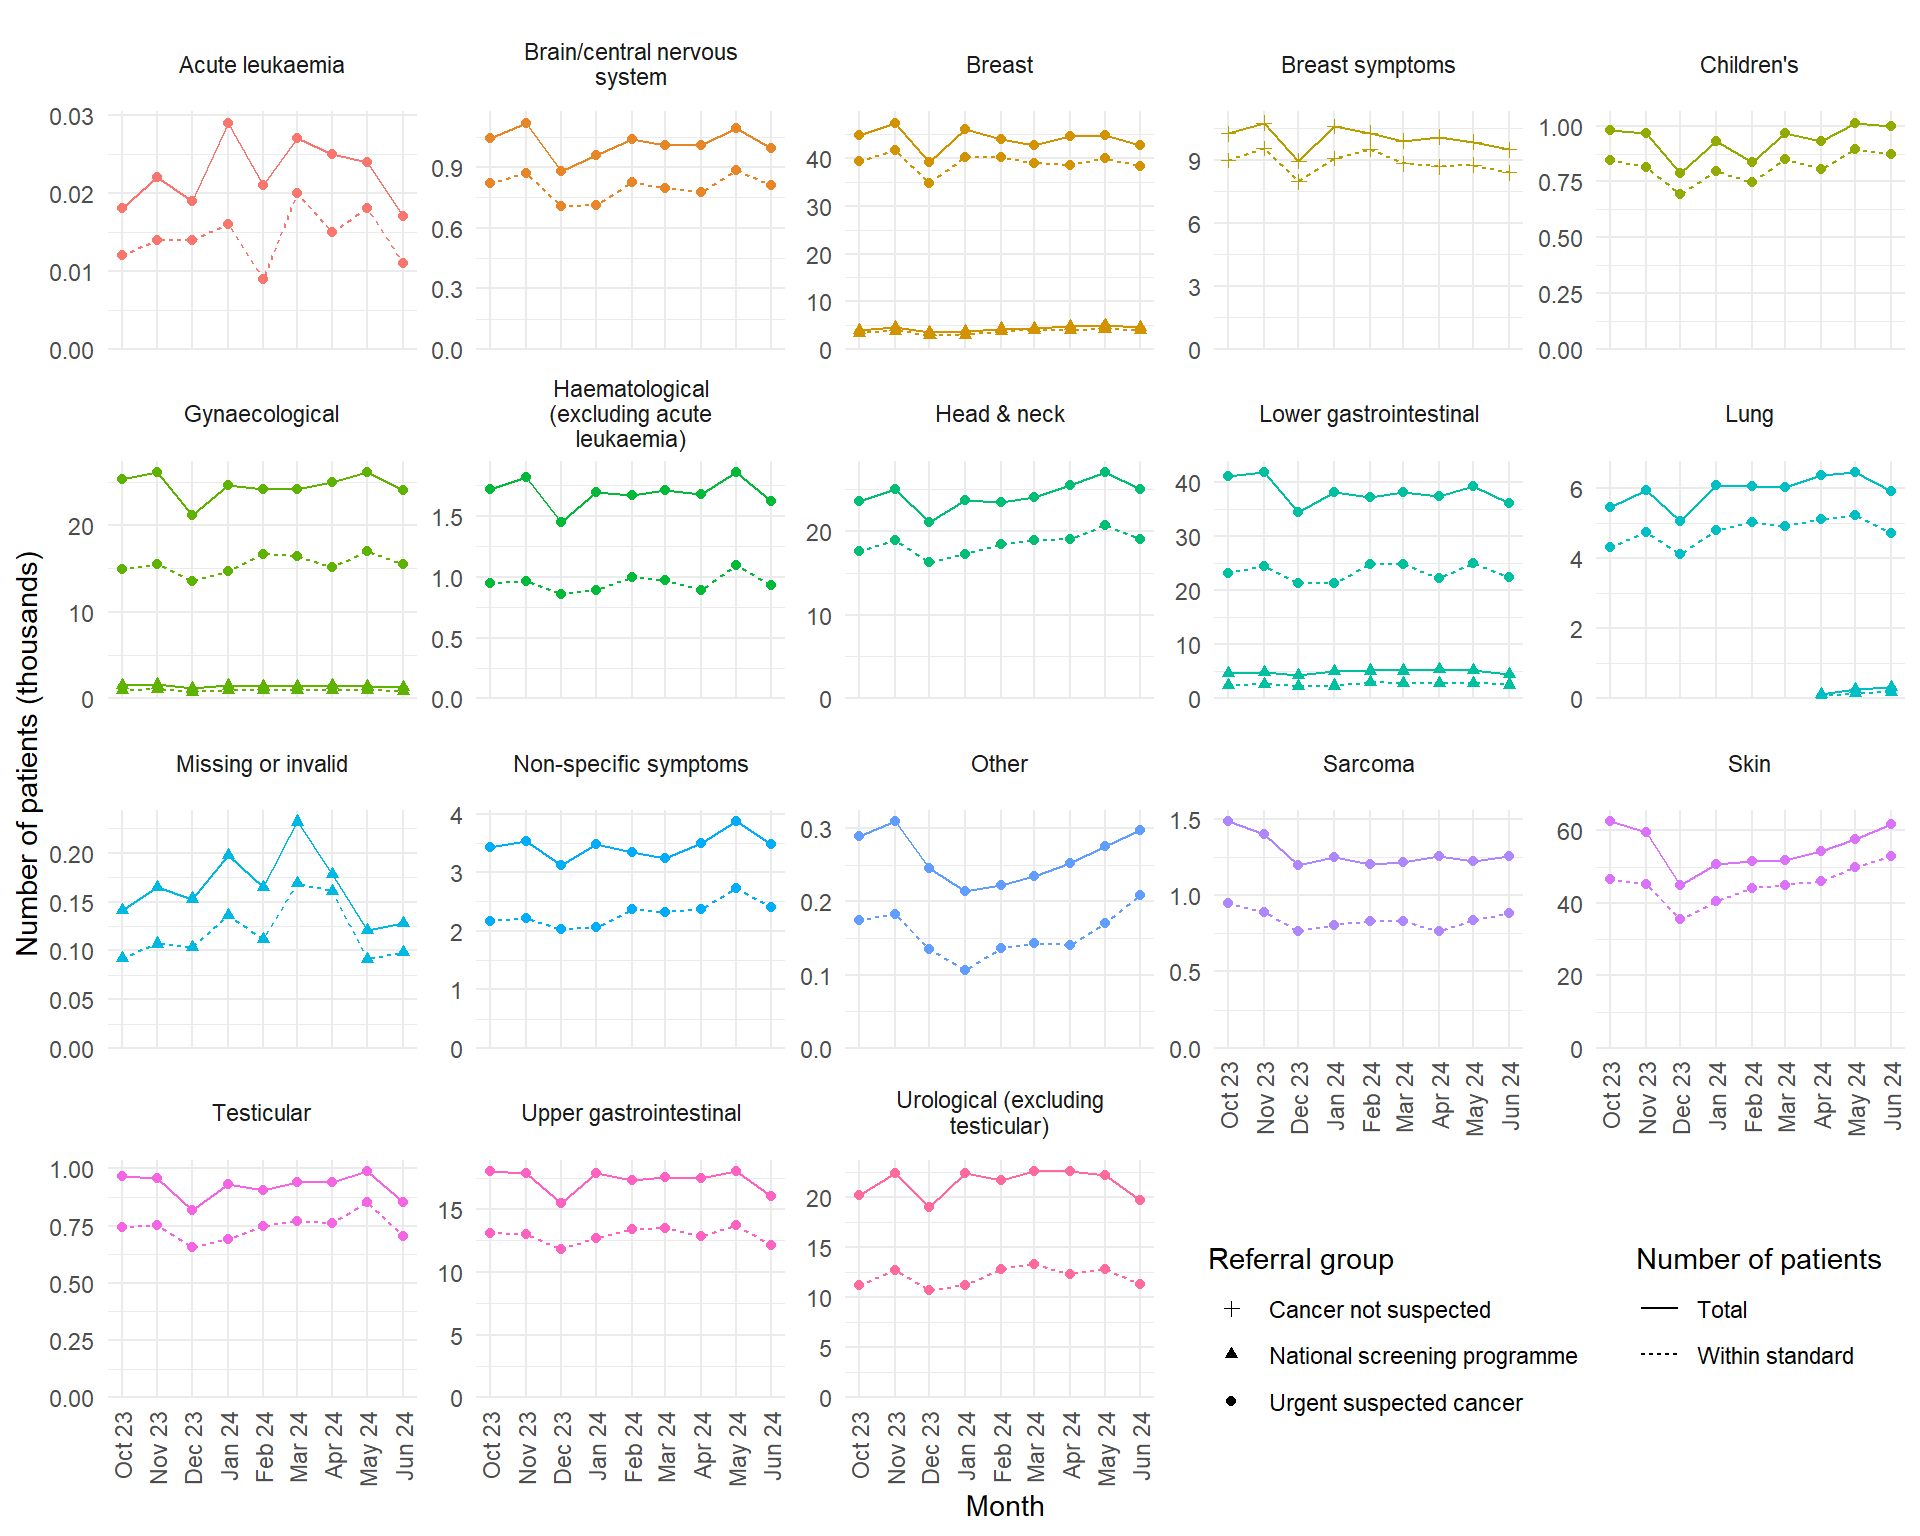
Figure 2: 28-day Faster Diagnosis Standard - Total number of patients (solid line) and the number within standard (dashed line) over time, by cancer type and referral group
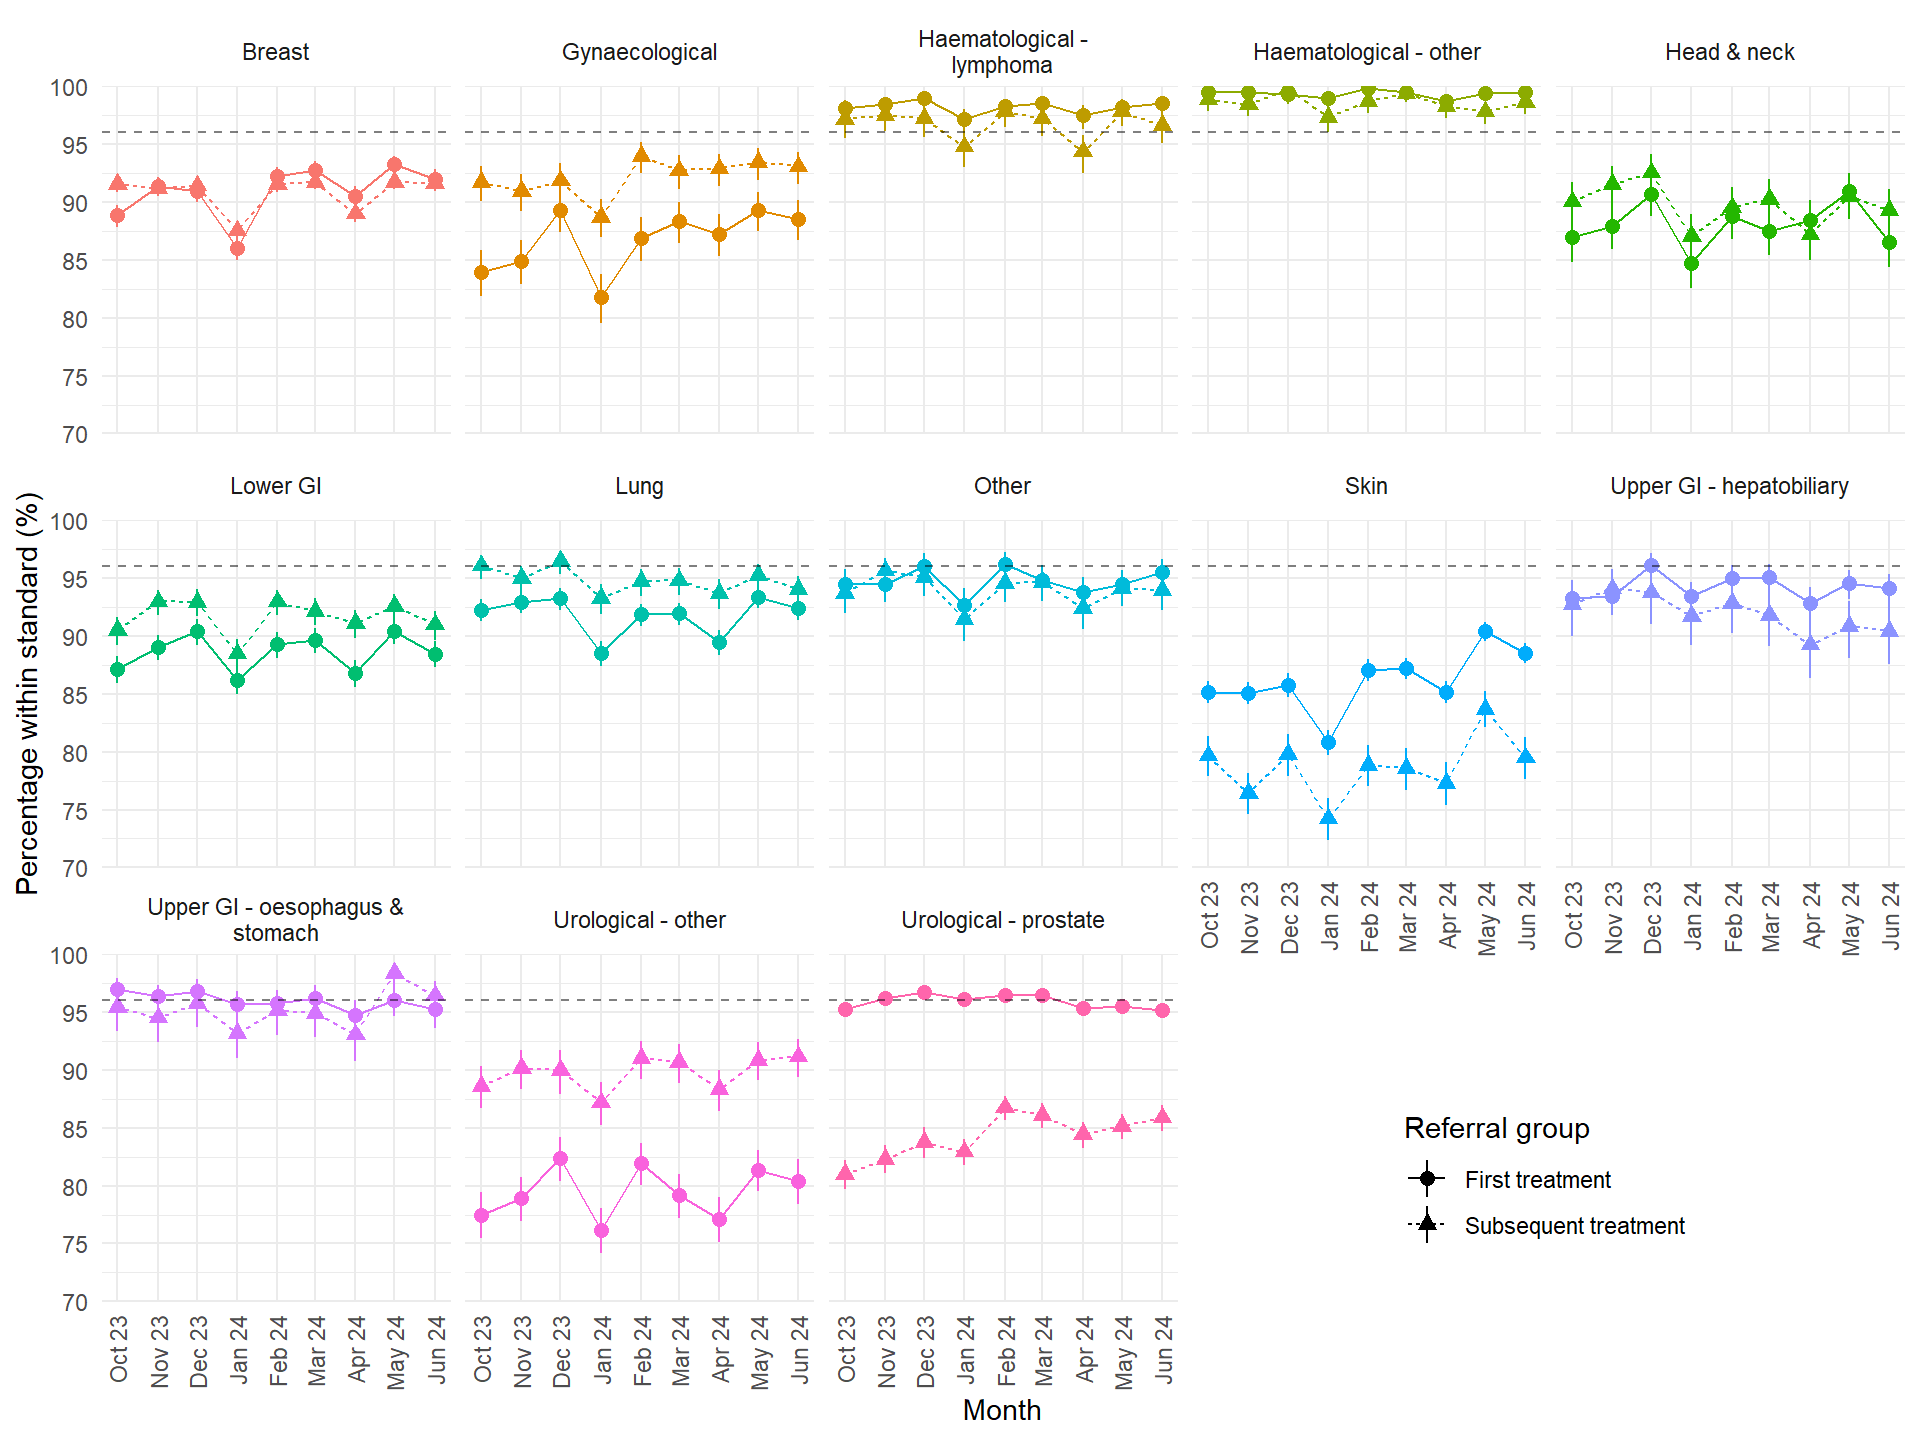
Figure 3: 31-day treatment standard - Percentage of patients within standard (and 95% confidence intervals) over time, by cancer type and referral group. The dashed line at 96% indicates the national objective.
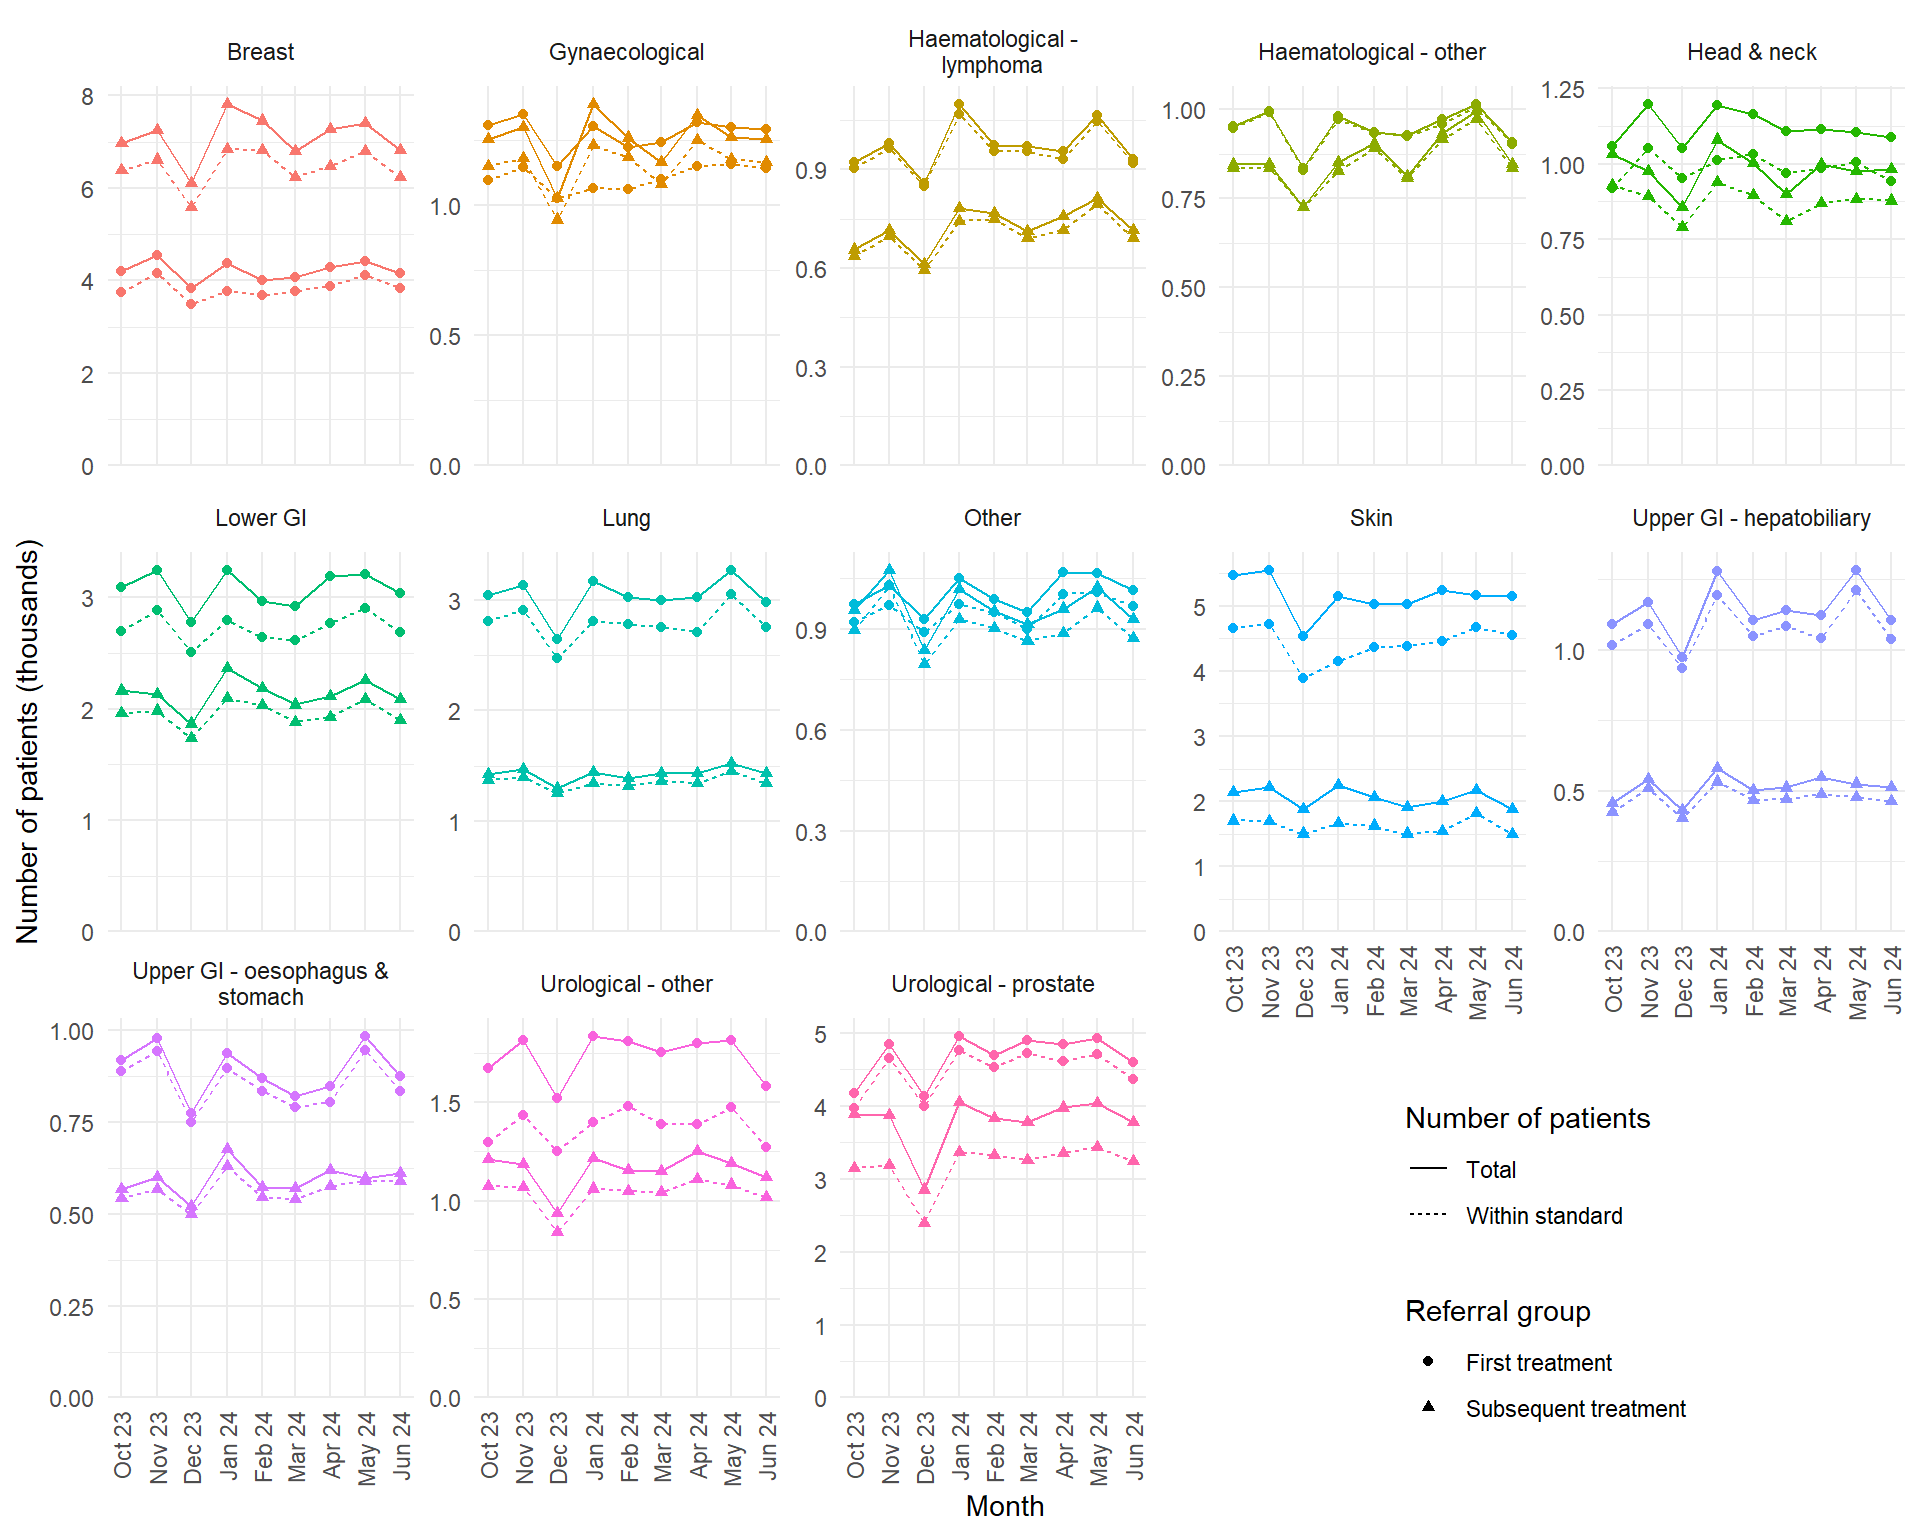
Figure 4: 31-day treatment standard - Total number of patients (solid line) and the number within standard (dashed line) over time, by cancer type and referral group
Figure 5: 31-day treatment standard - Percentage of patients within standard (and 95% confidence intervals) over time, by treatment modality and referral group. The dashed line at 96% indicates the national objective.
Figure 6: 31-day treatment standard - Total number of patients (solid line) and the number within standard (dashed line) over time, by treatment modality and referral group
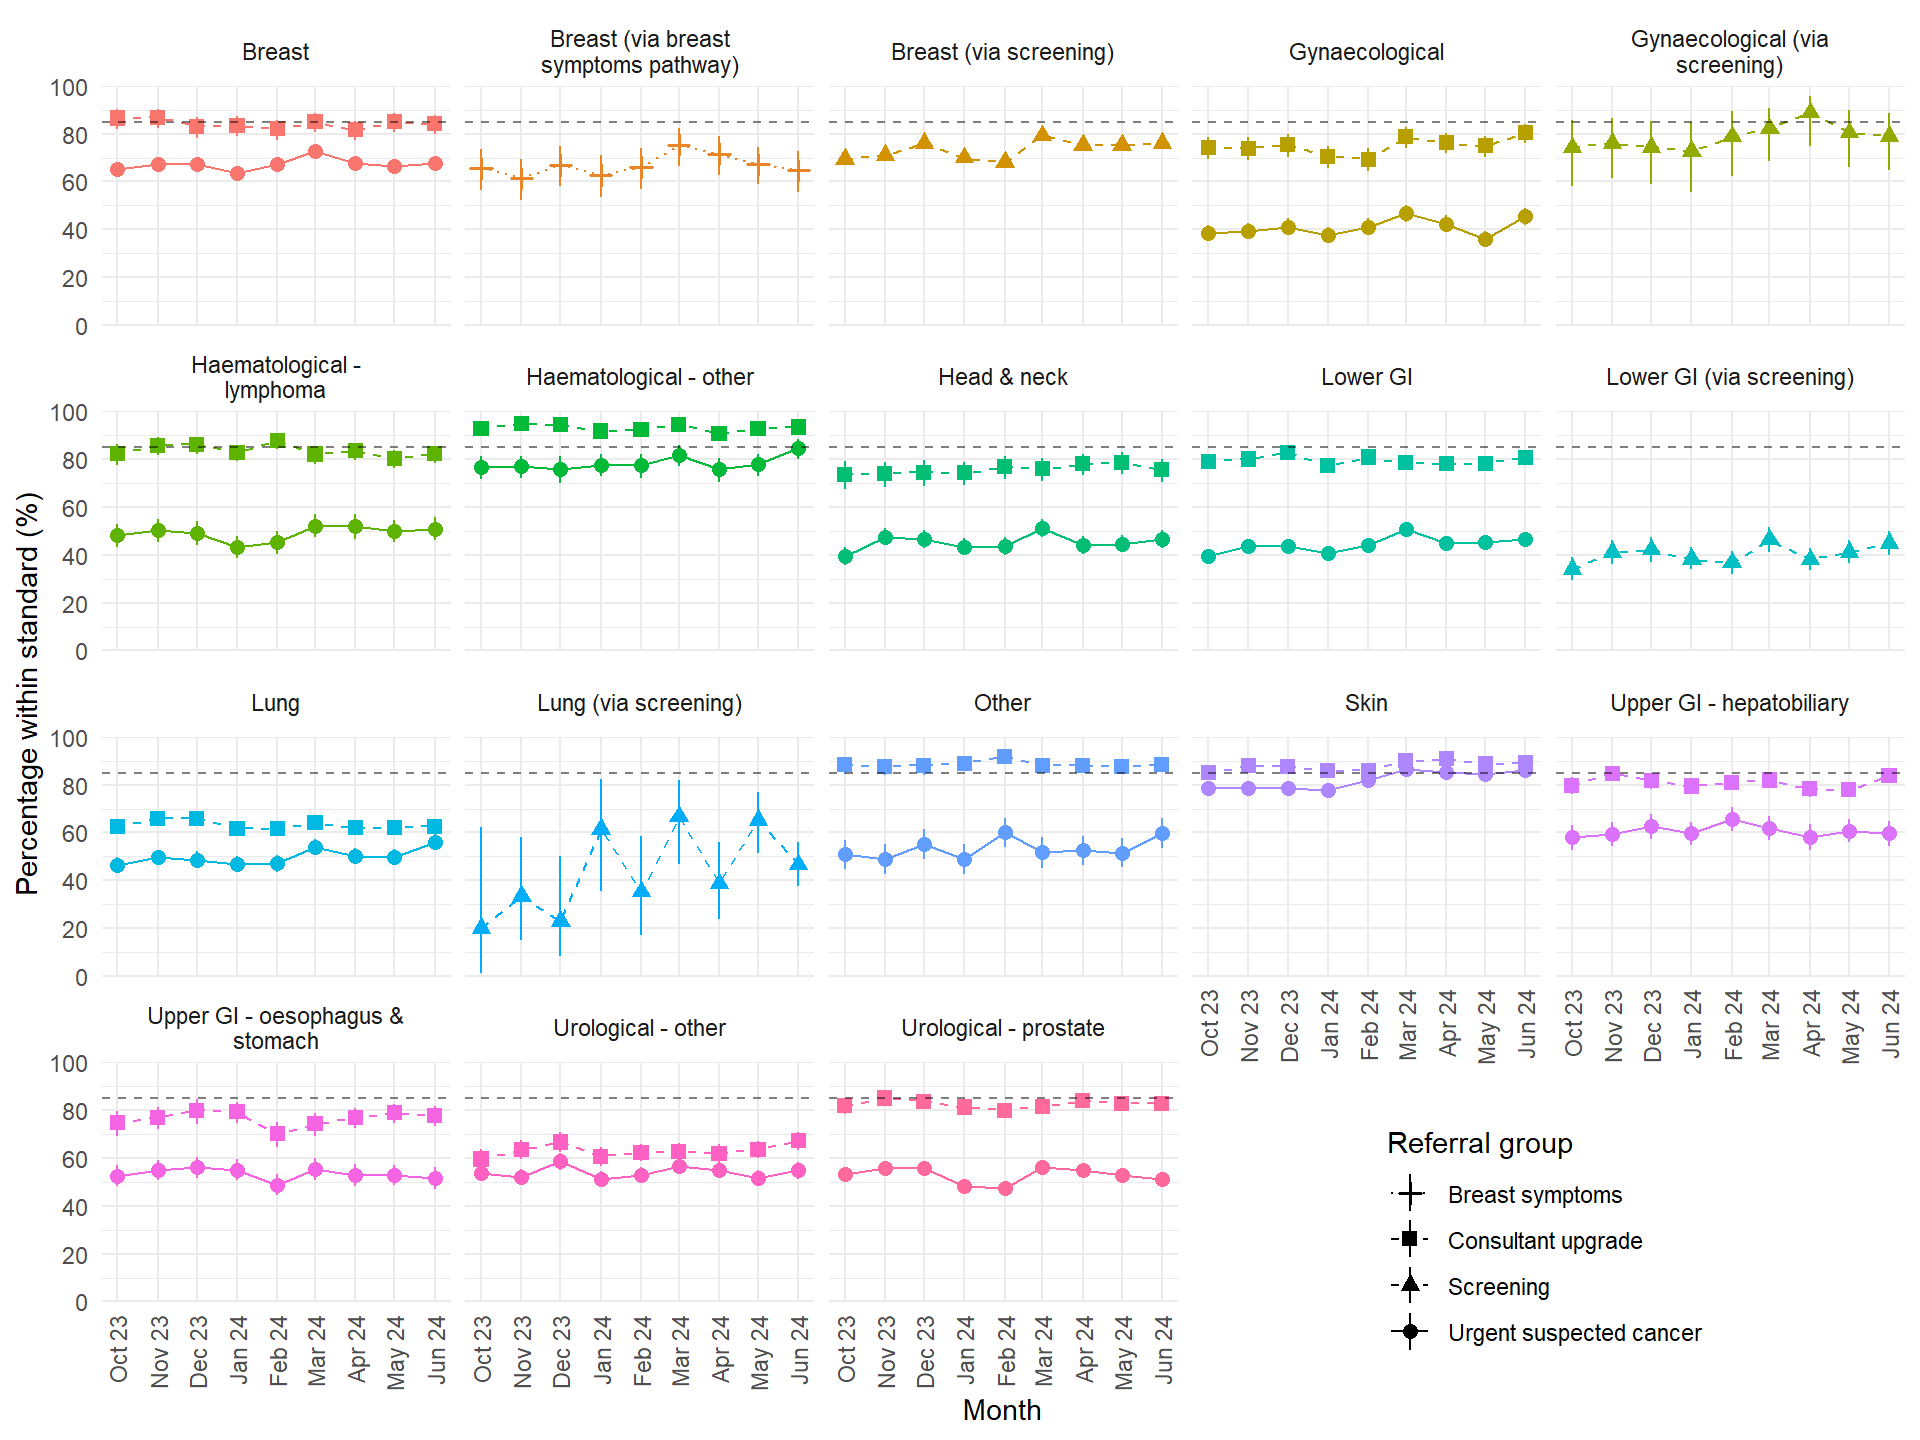
Figure 7: 62-day treatment standard - Percentage of patients within standard (and 95% confidence intervals) over time, by cancer type and referral group. The dashed line at 85% indicates the national objective.
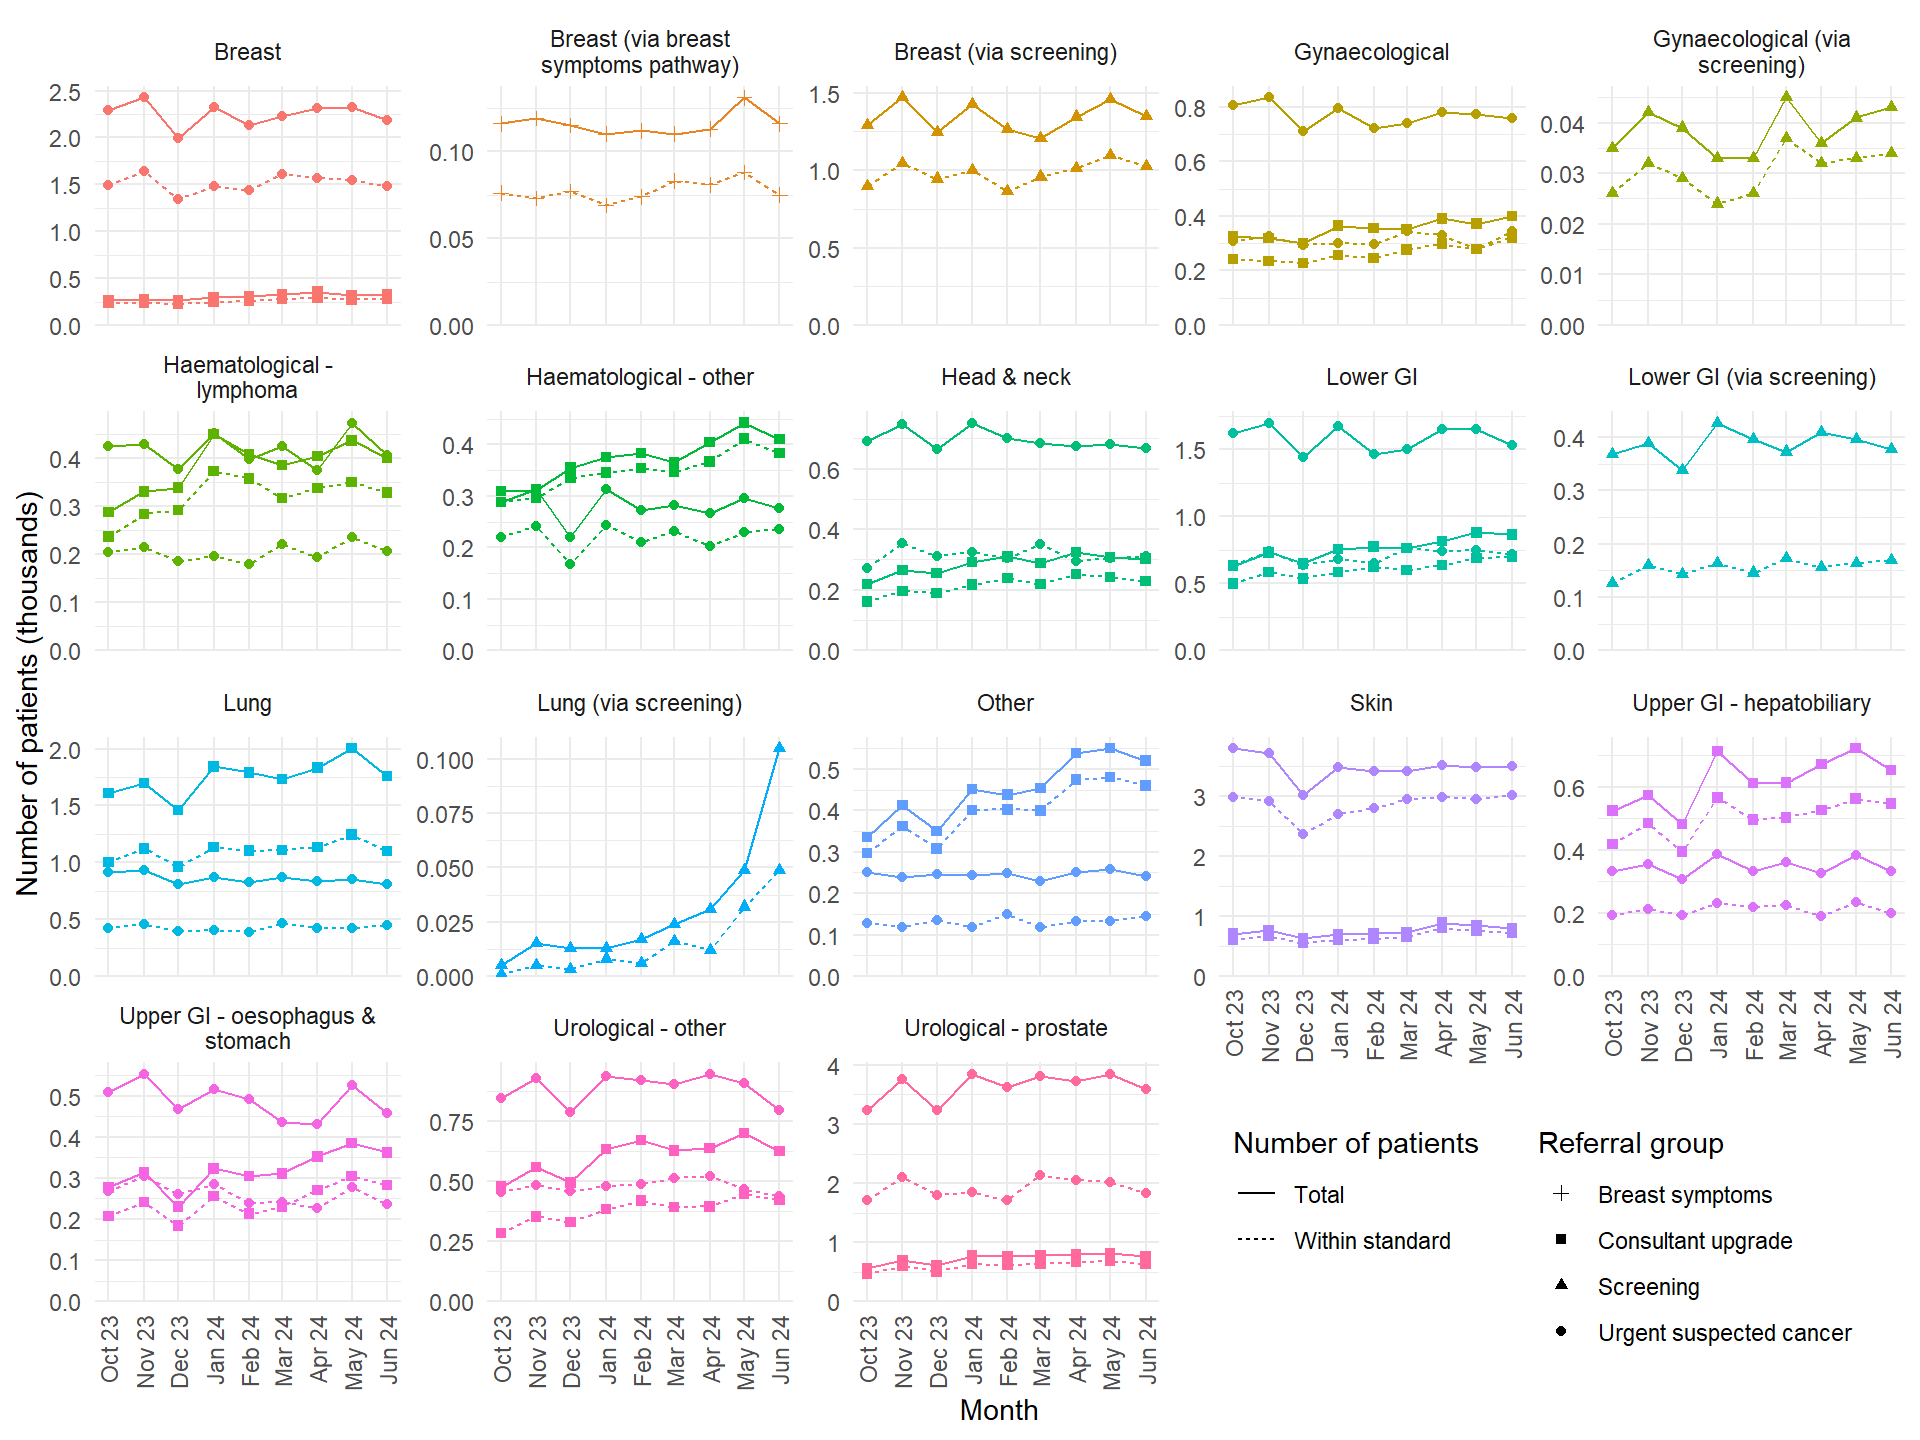
Figure 8: 62-day treatment standard - Total number of patients (solid line) and the number within standard (dashed line) over time, by cancer type and referral group
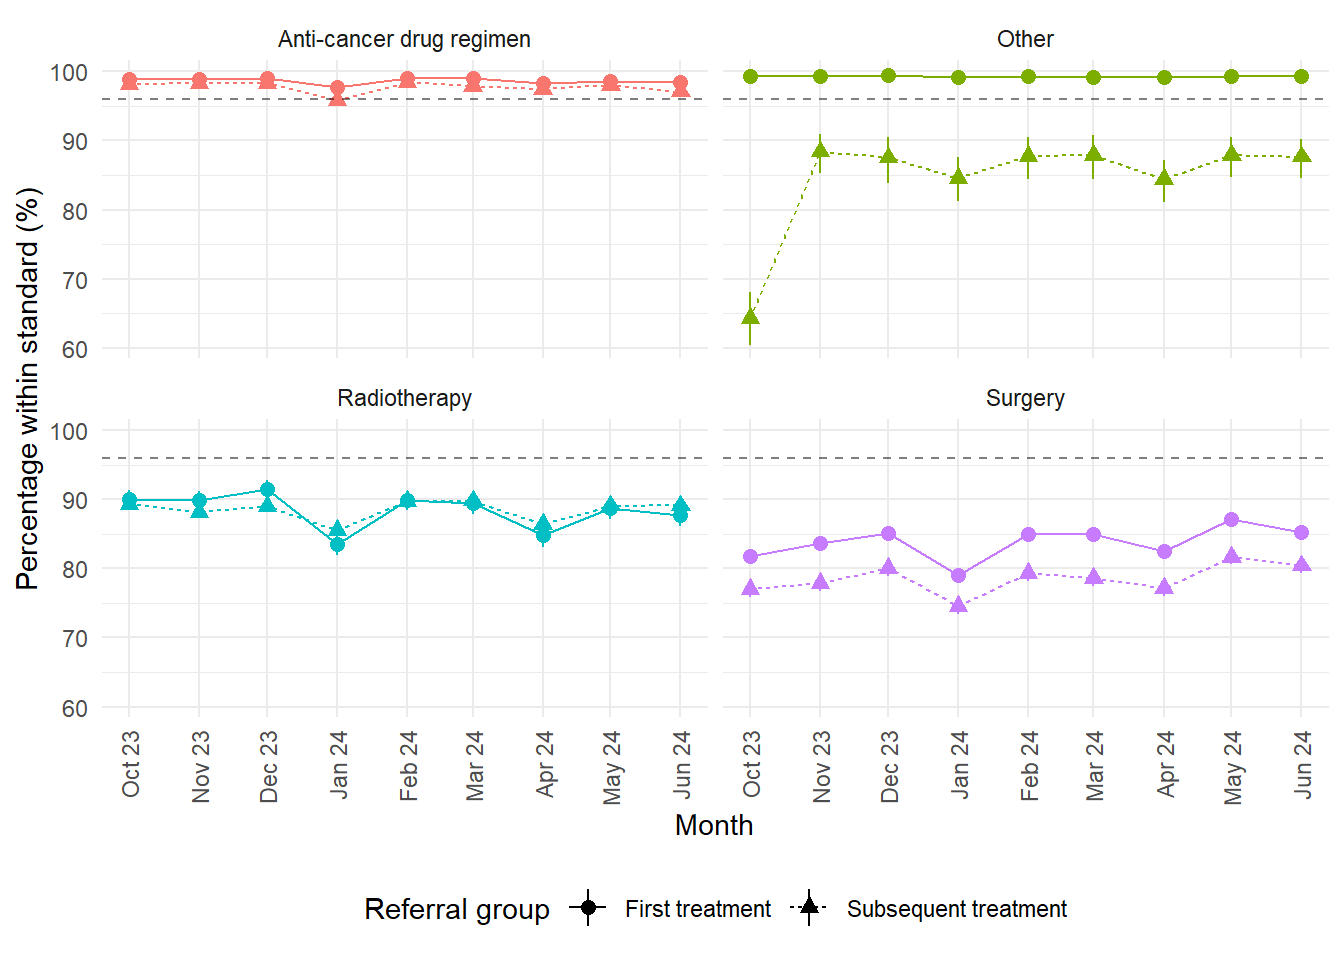
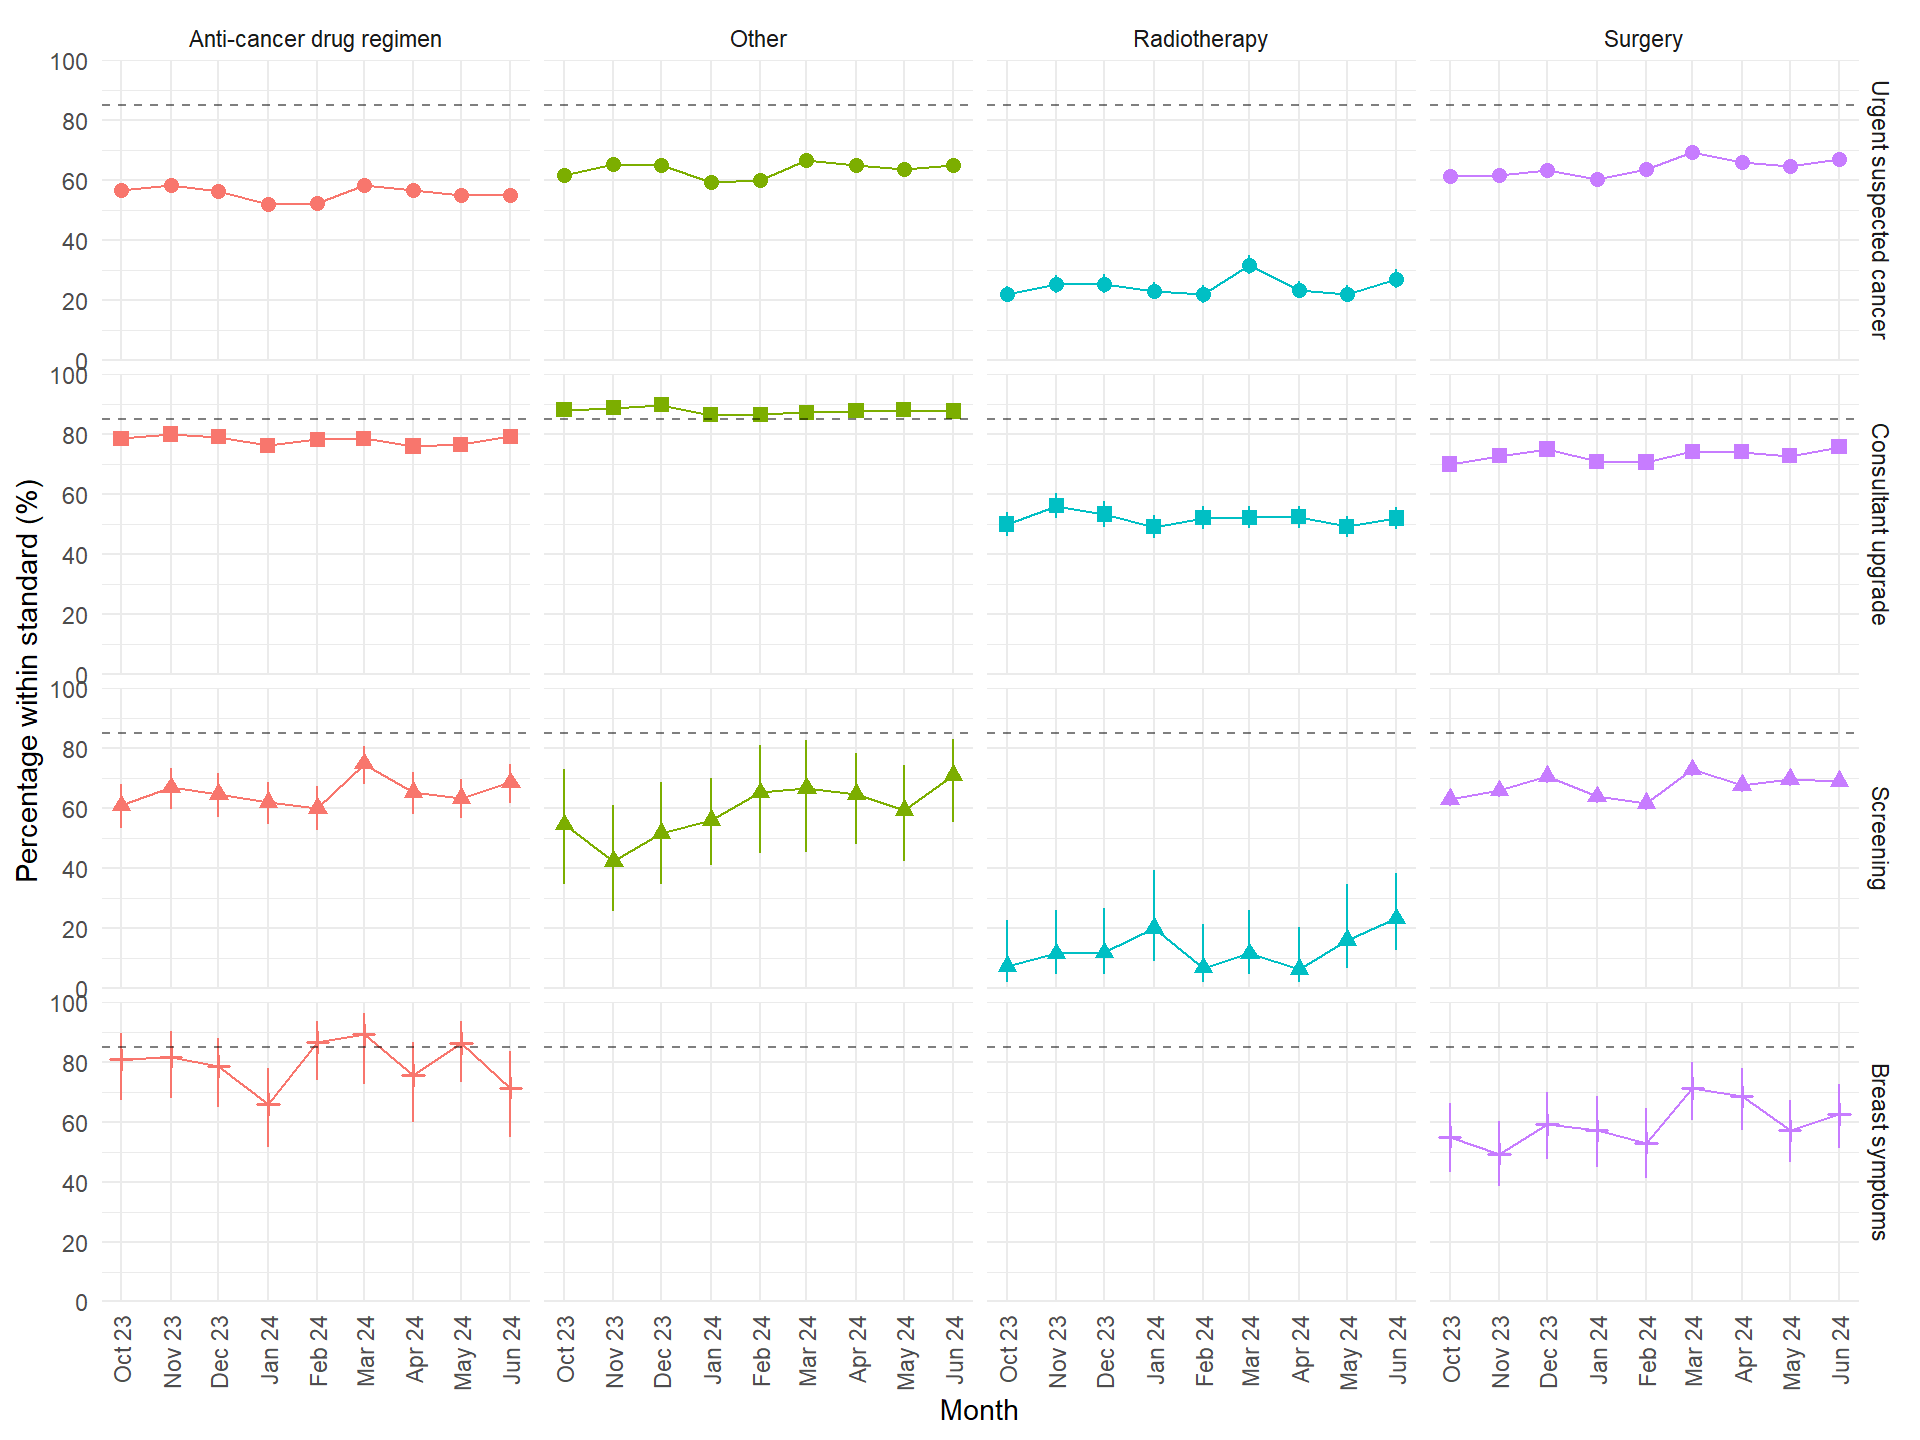
Figure 9: 62-day treatment standard - Percentage of patients within standard (and 95% confidence intervals) over time, by treatment modality and referral group. The dashed line at 85% indicates the national objective.
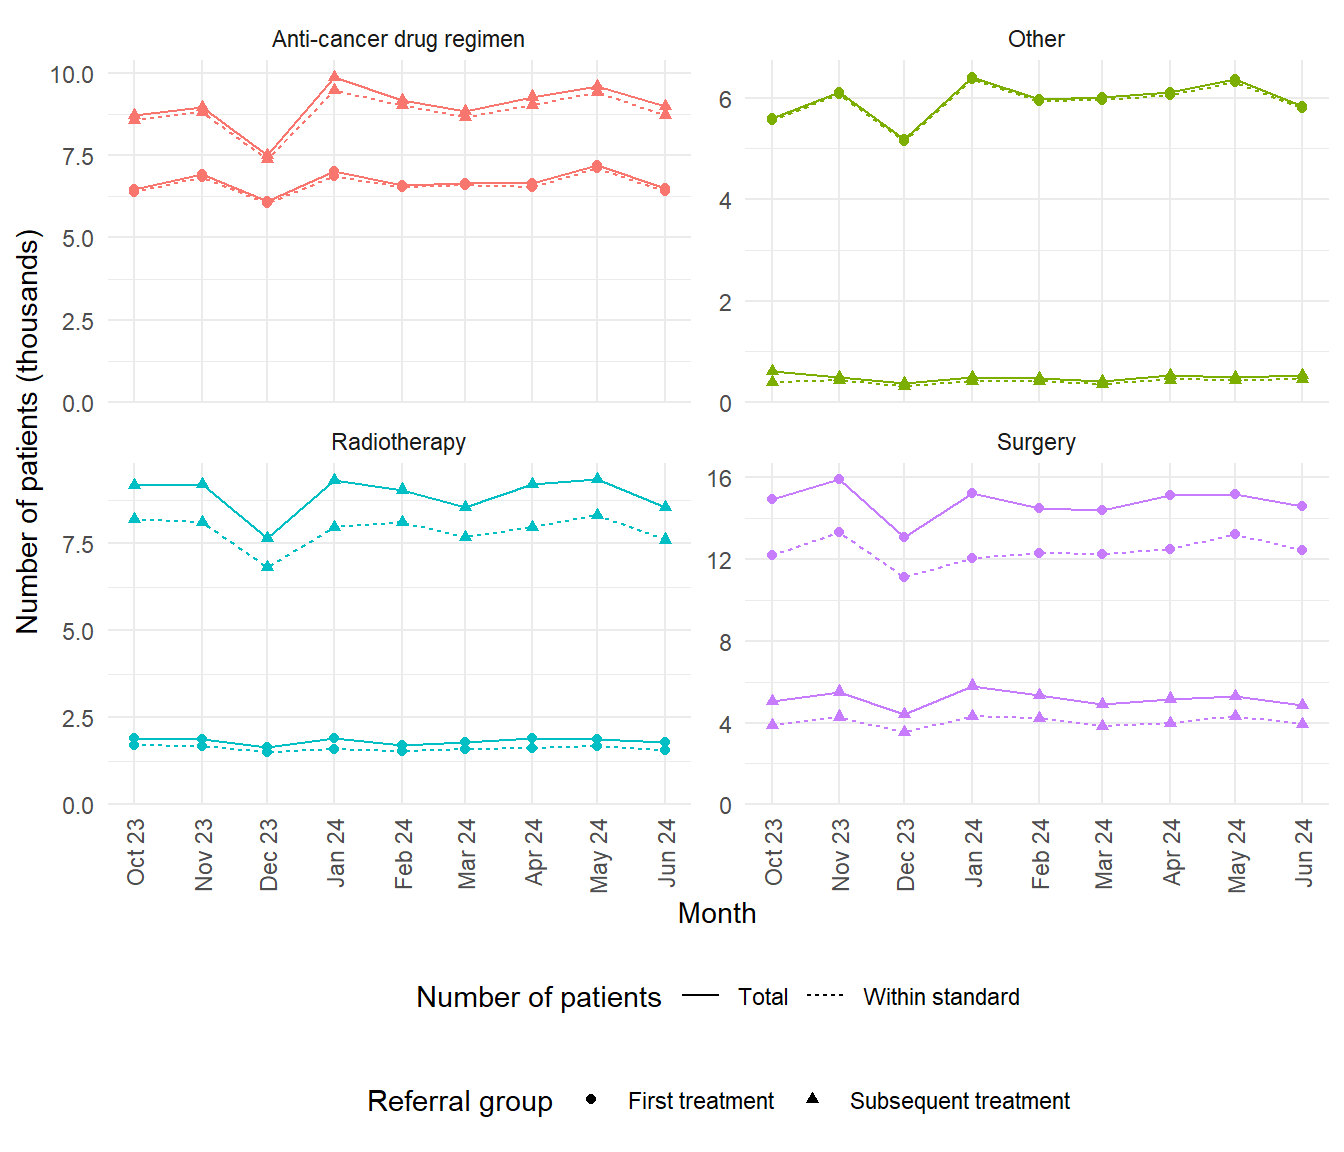
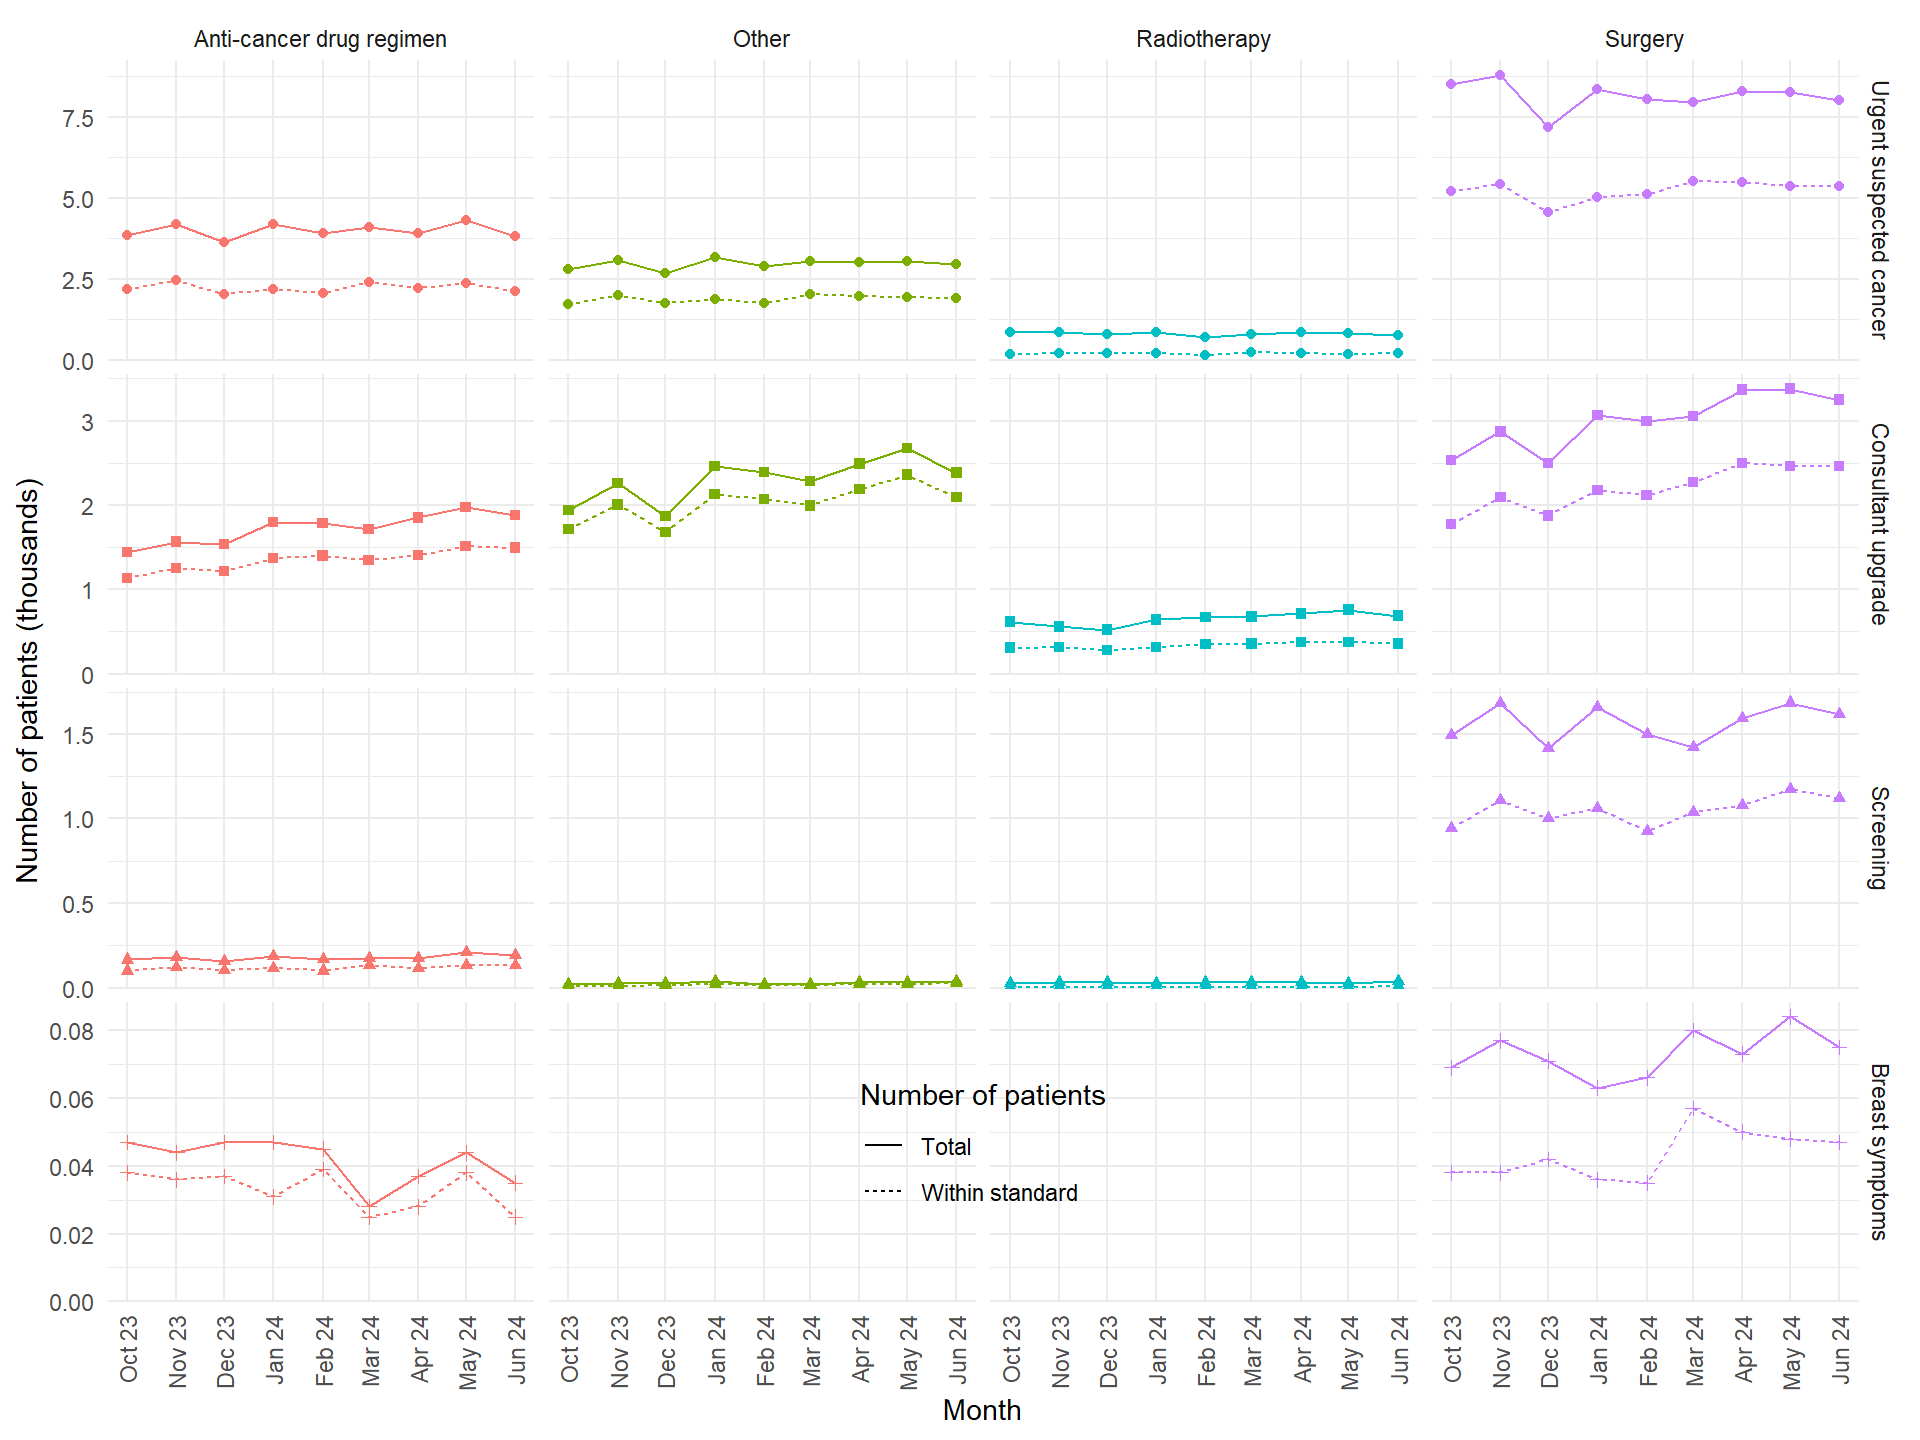
Figure 10: 62-day treatment standard - Total number of patients (solid line) and the number within standard (dashed line) over time, by treatment modality and referral group