Variation between regions within pathways
Summary
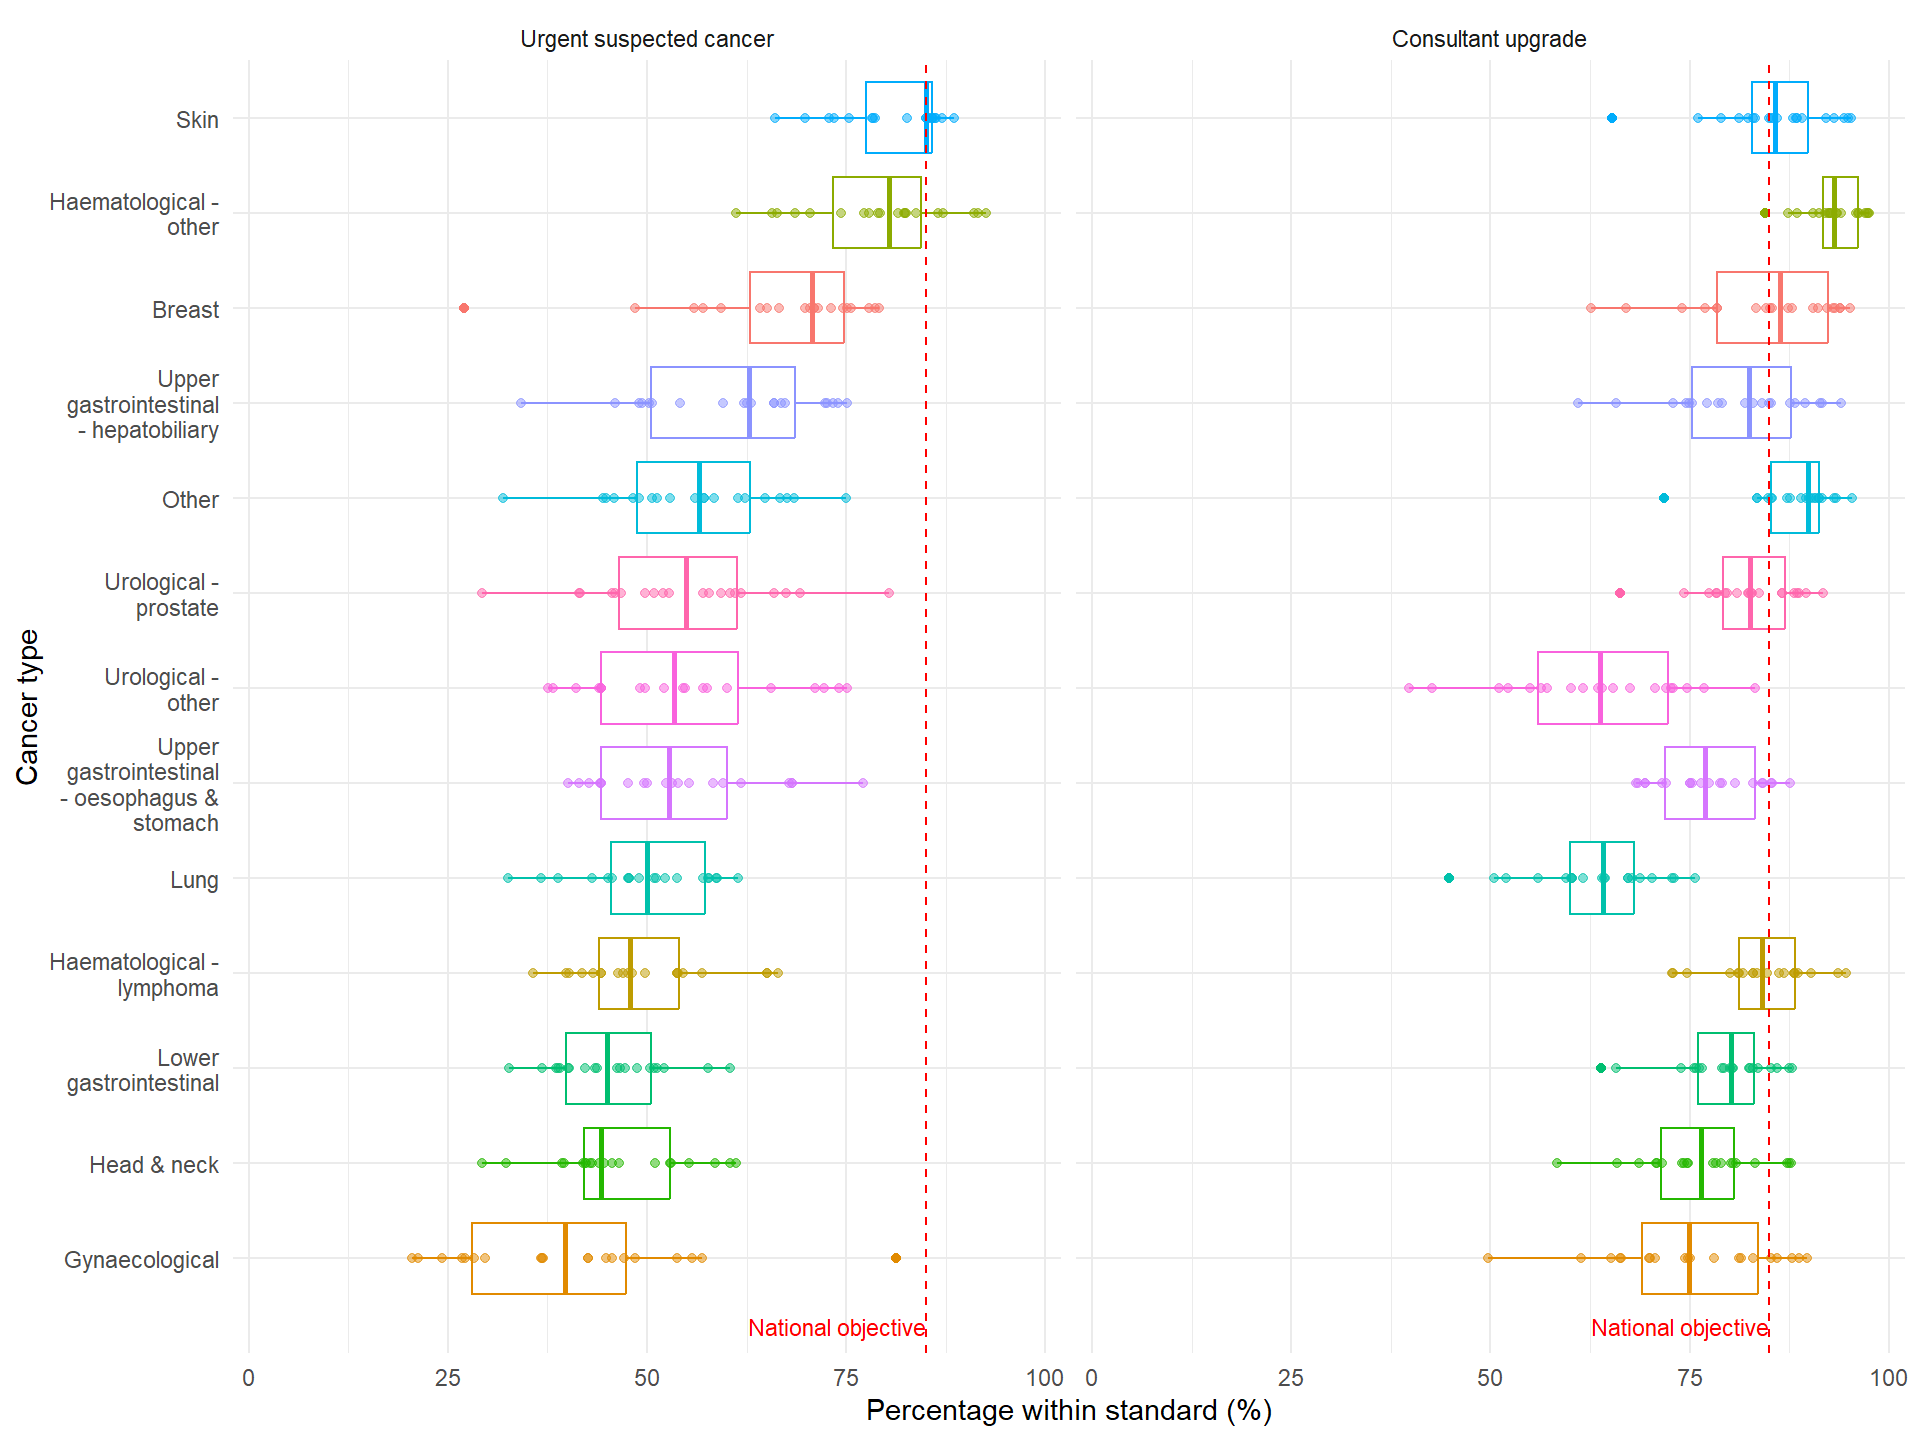
This page shows the percentages of patients within waiting times standards for separate Cancer Alliances within each pathway. It highlights the extent of variation across alliances within each pathway.
Time period of data: October 2023 to February 2025
28-day Faster Diagnosis Standard
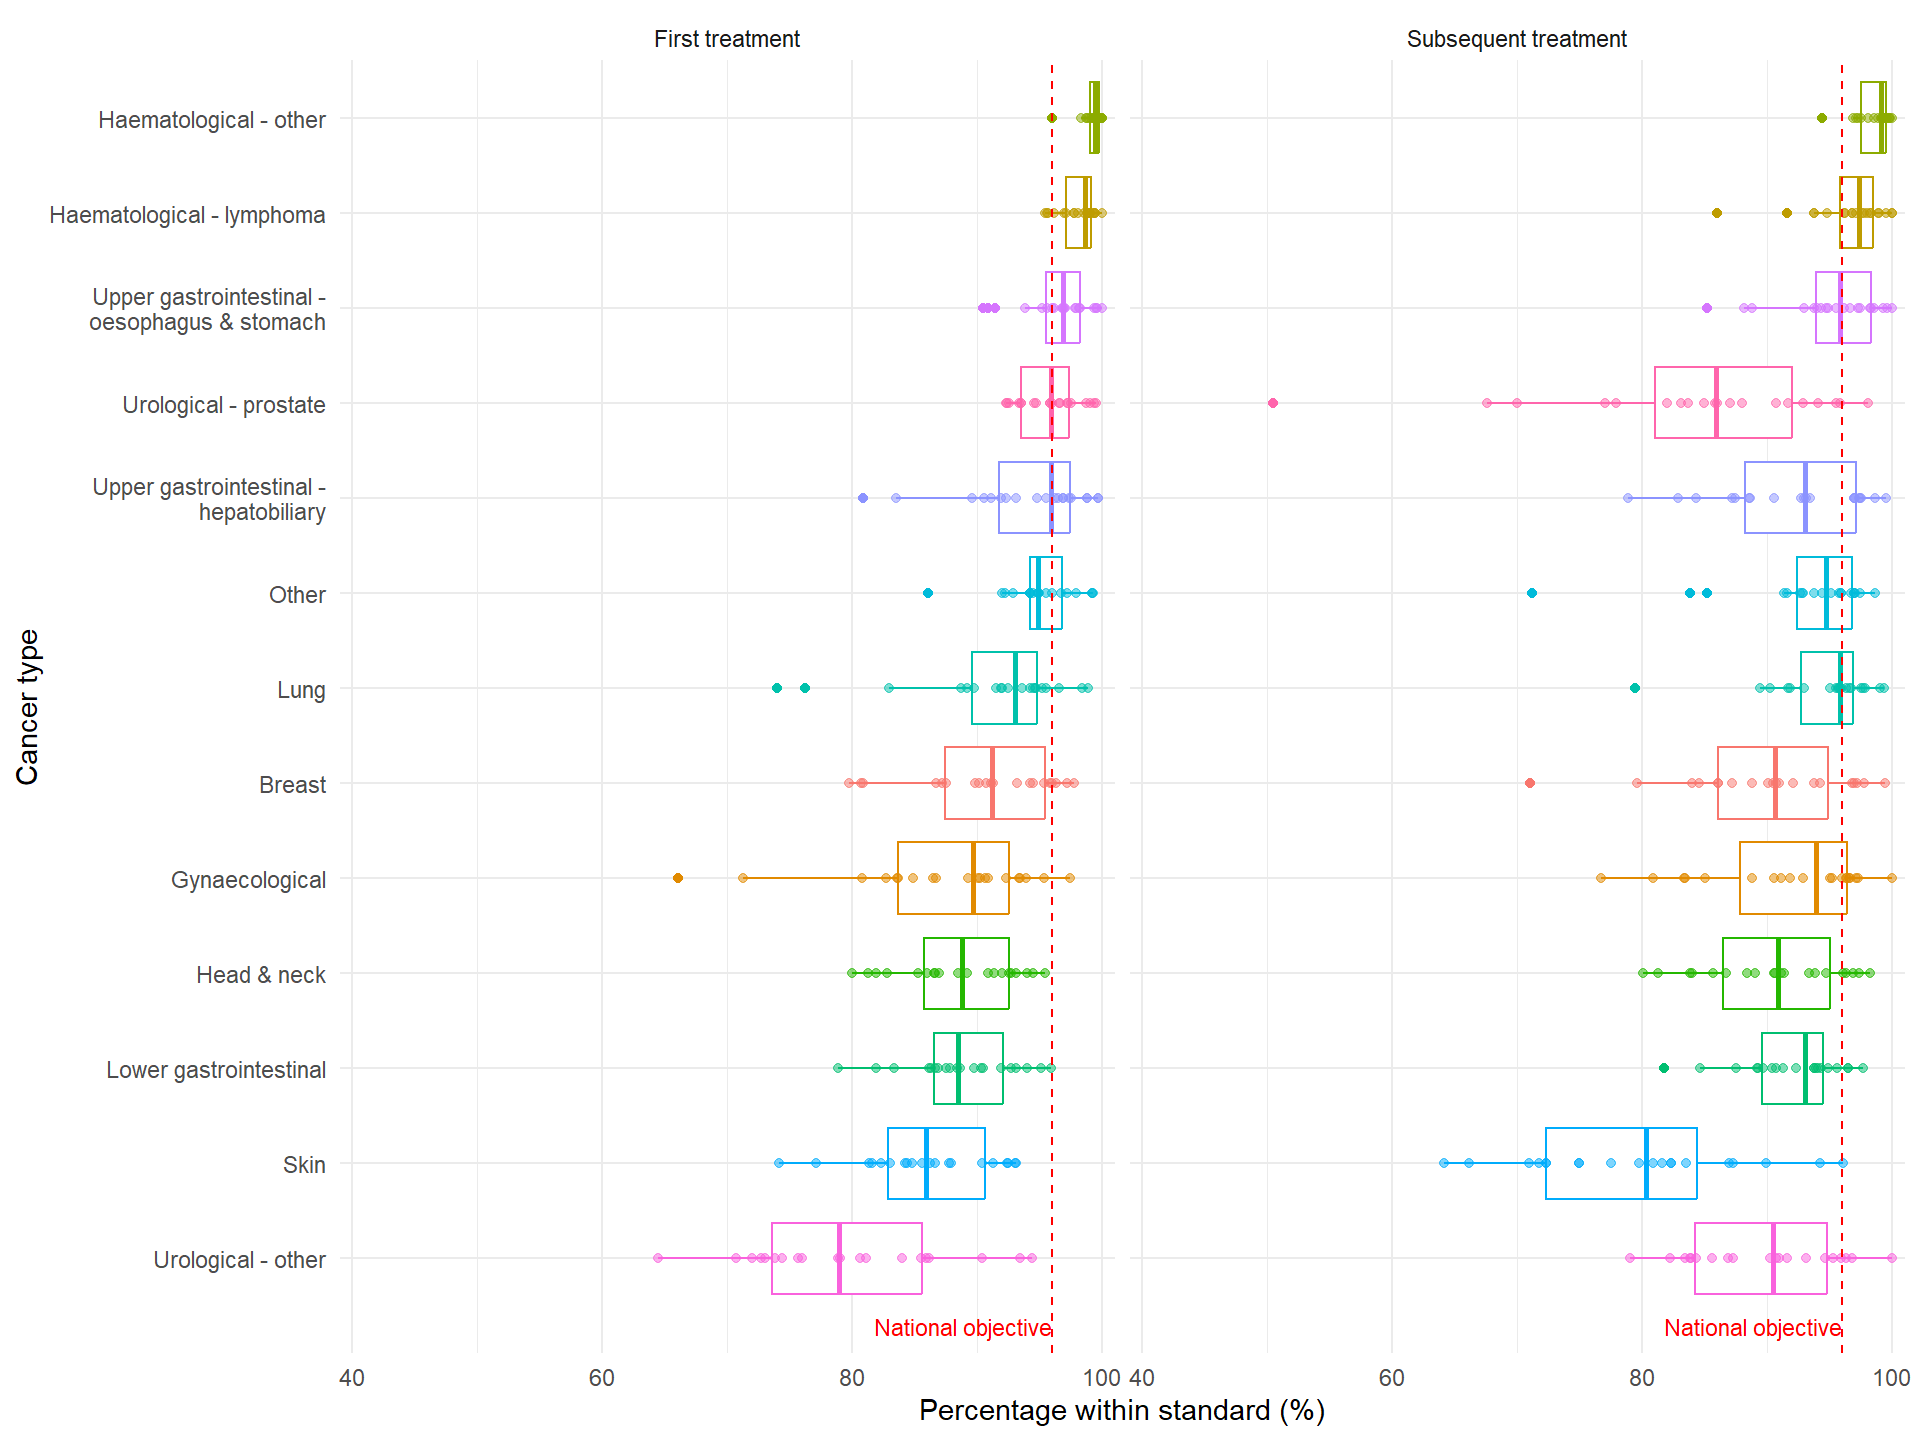
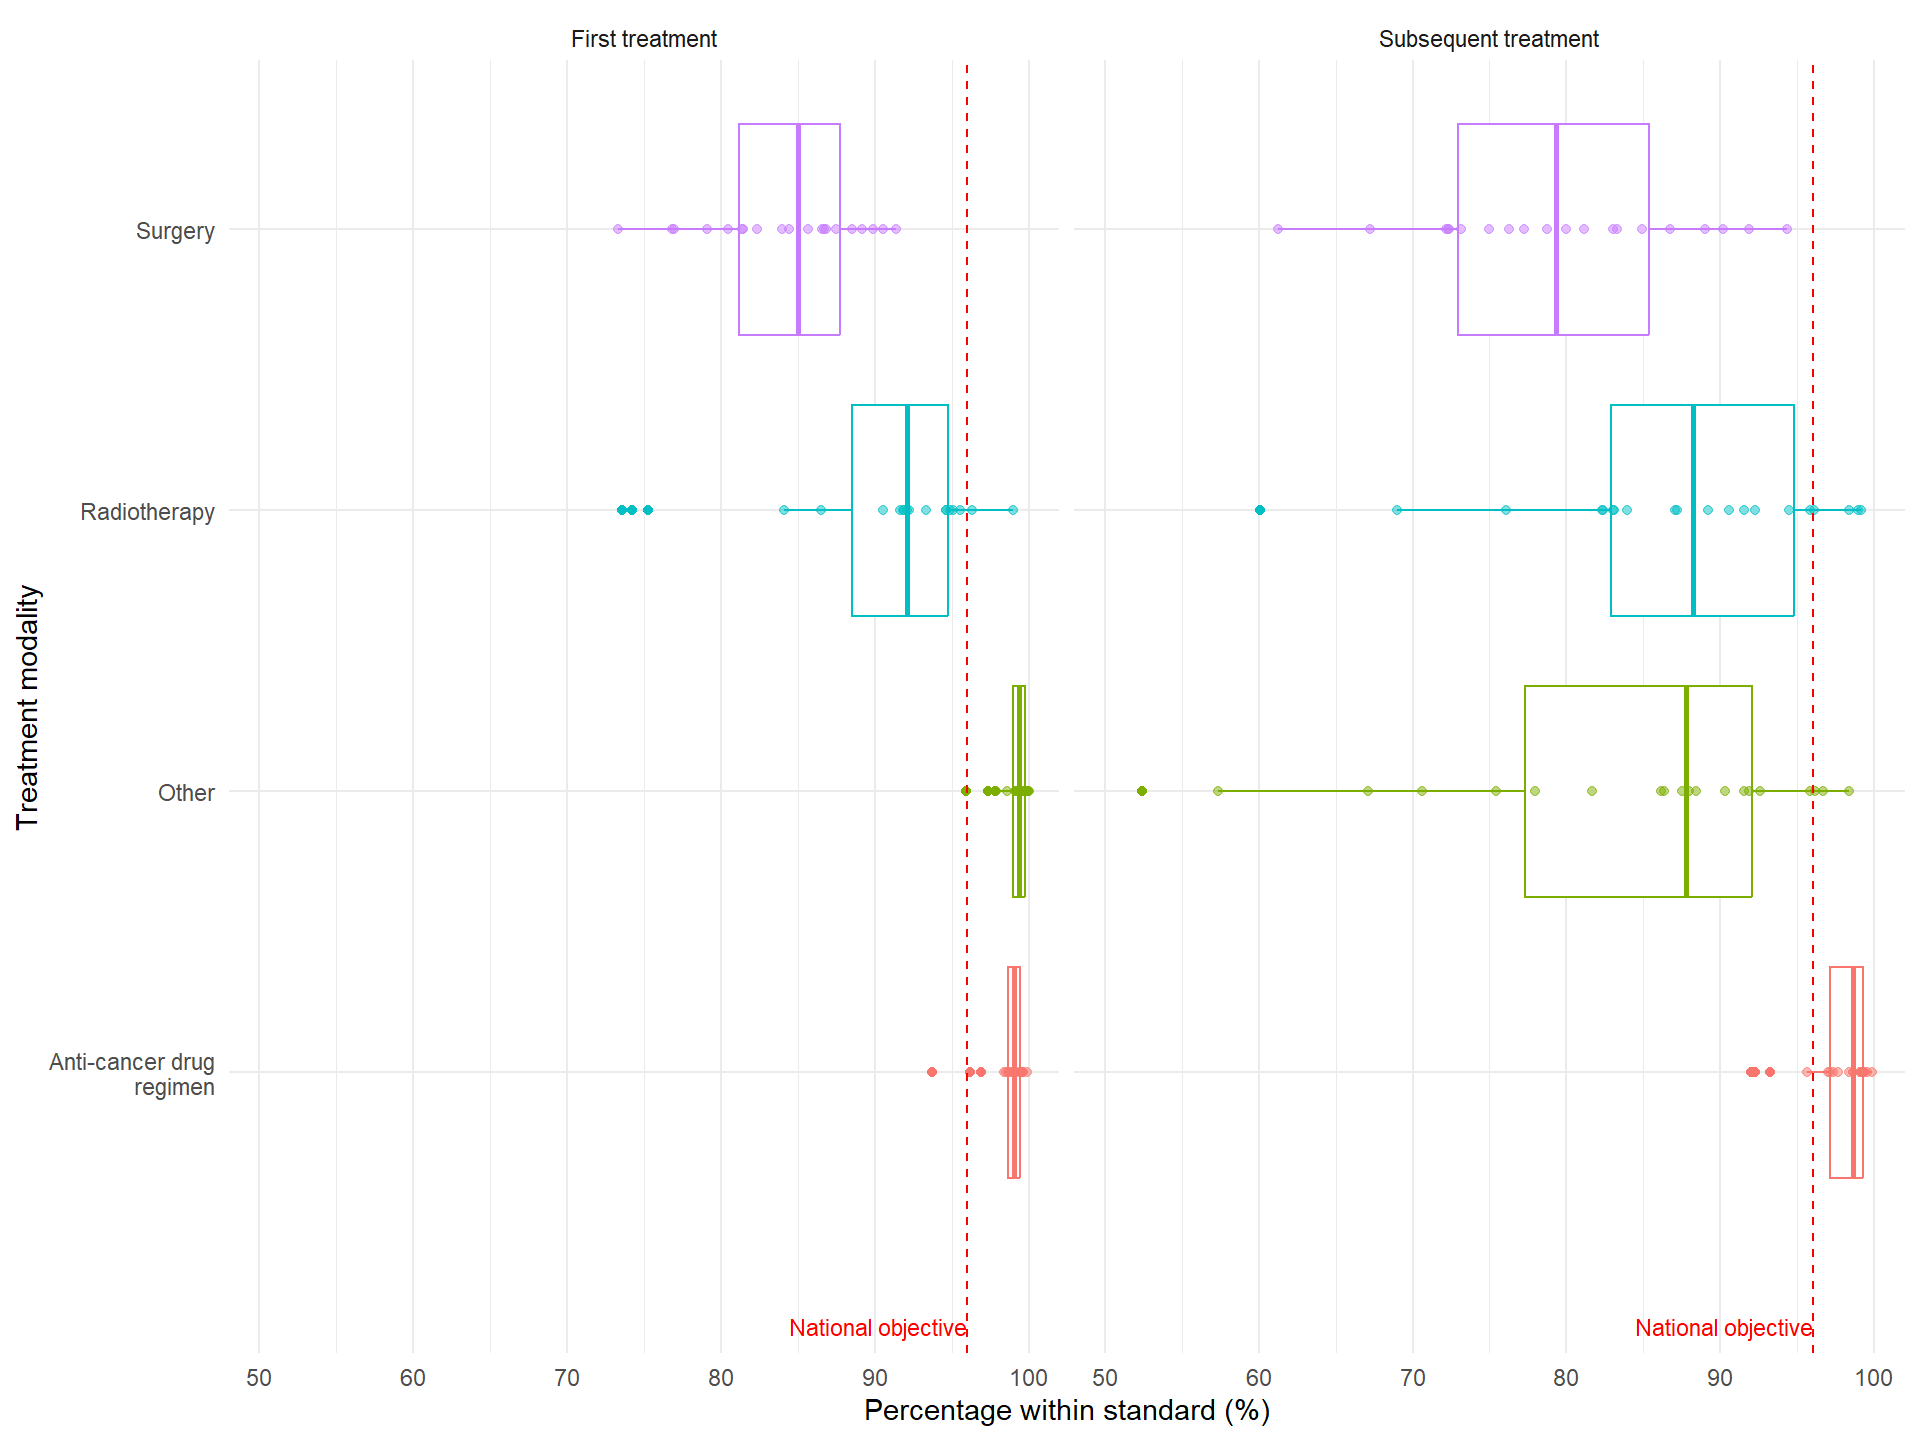
31-day treatment standard
Cancer type by first or subsequent treatment
Treatment modality by first or subsequent treatment
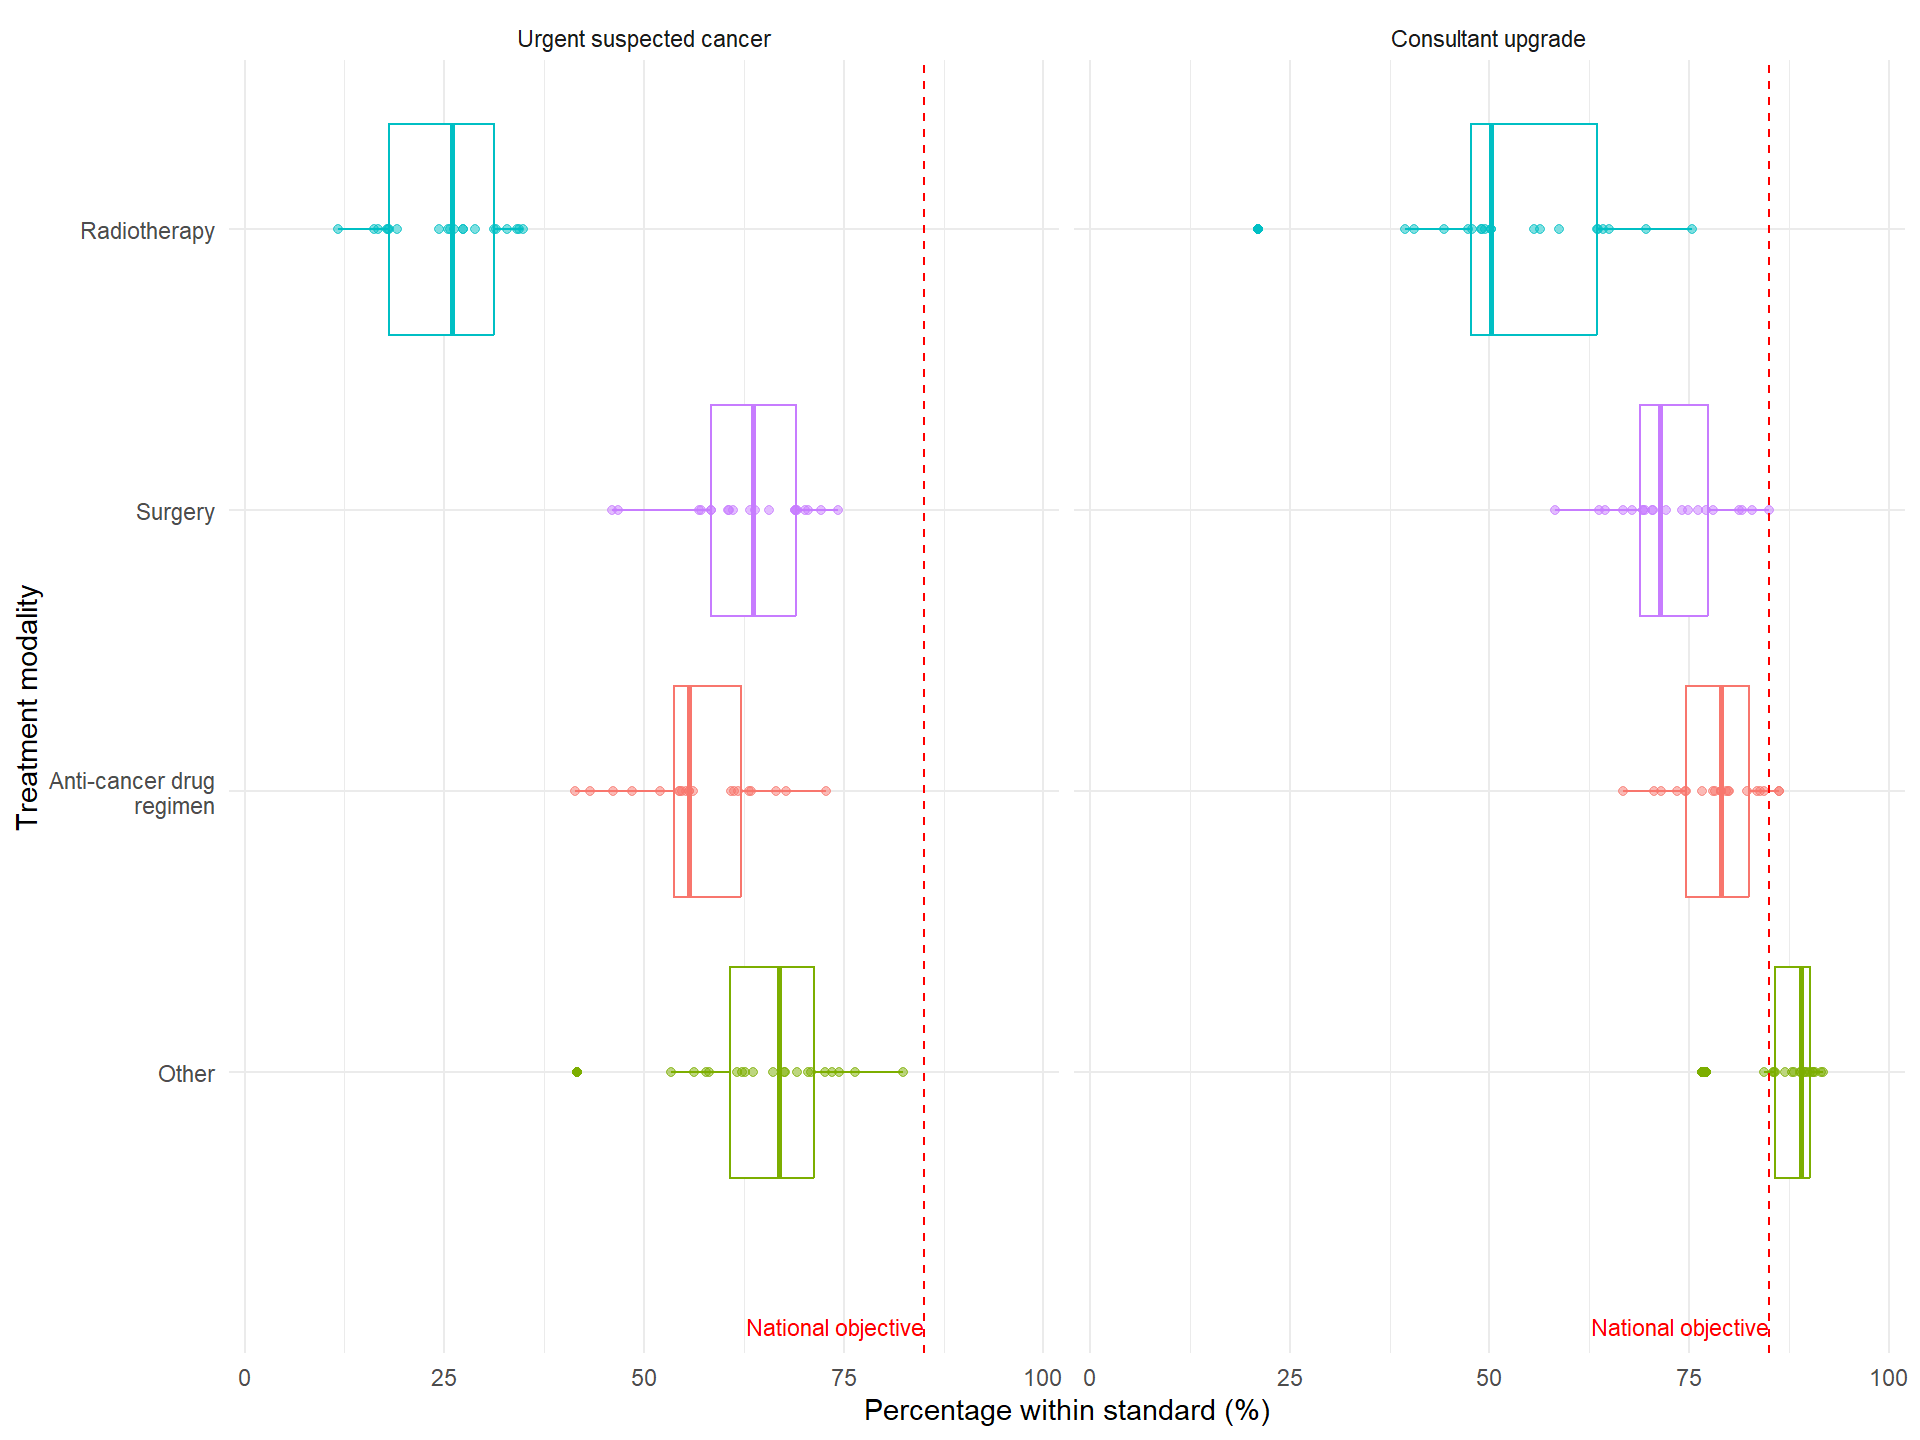
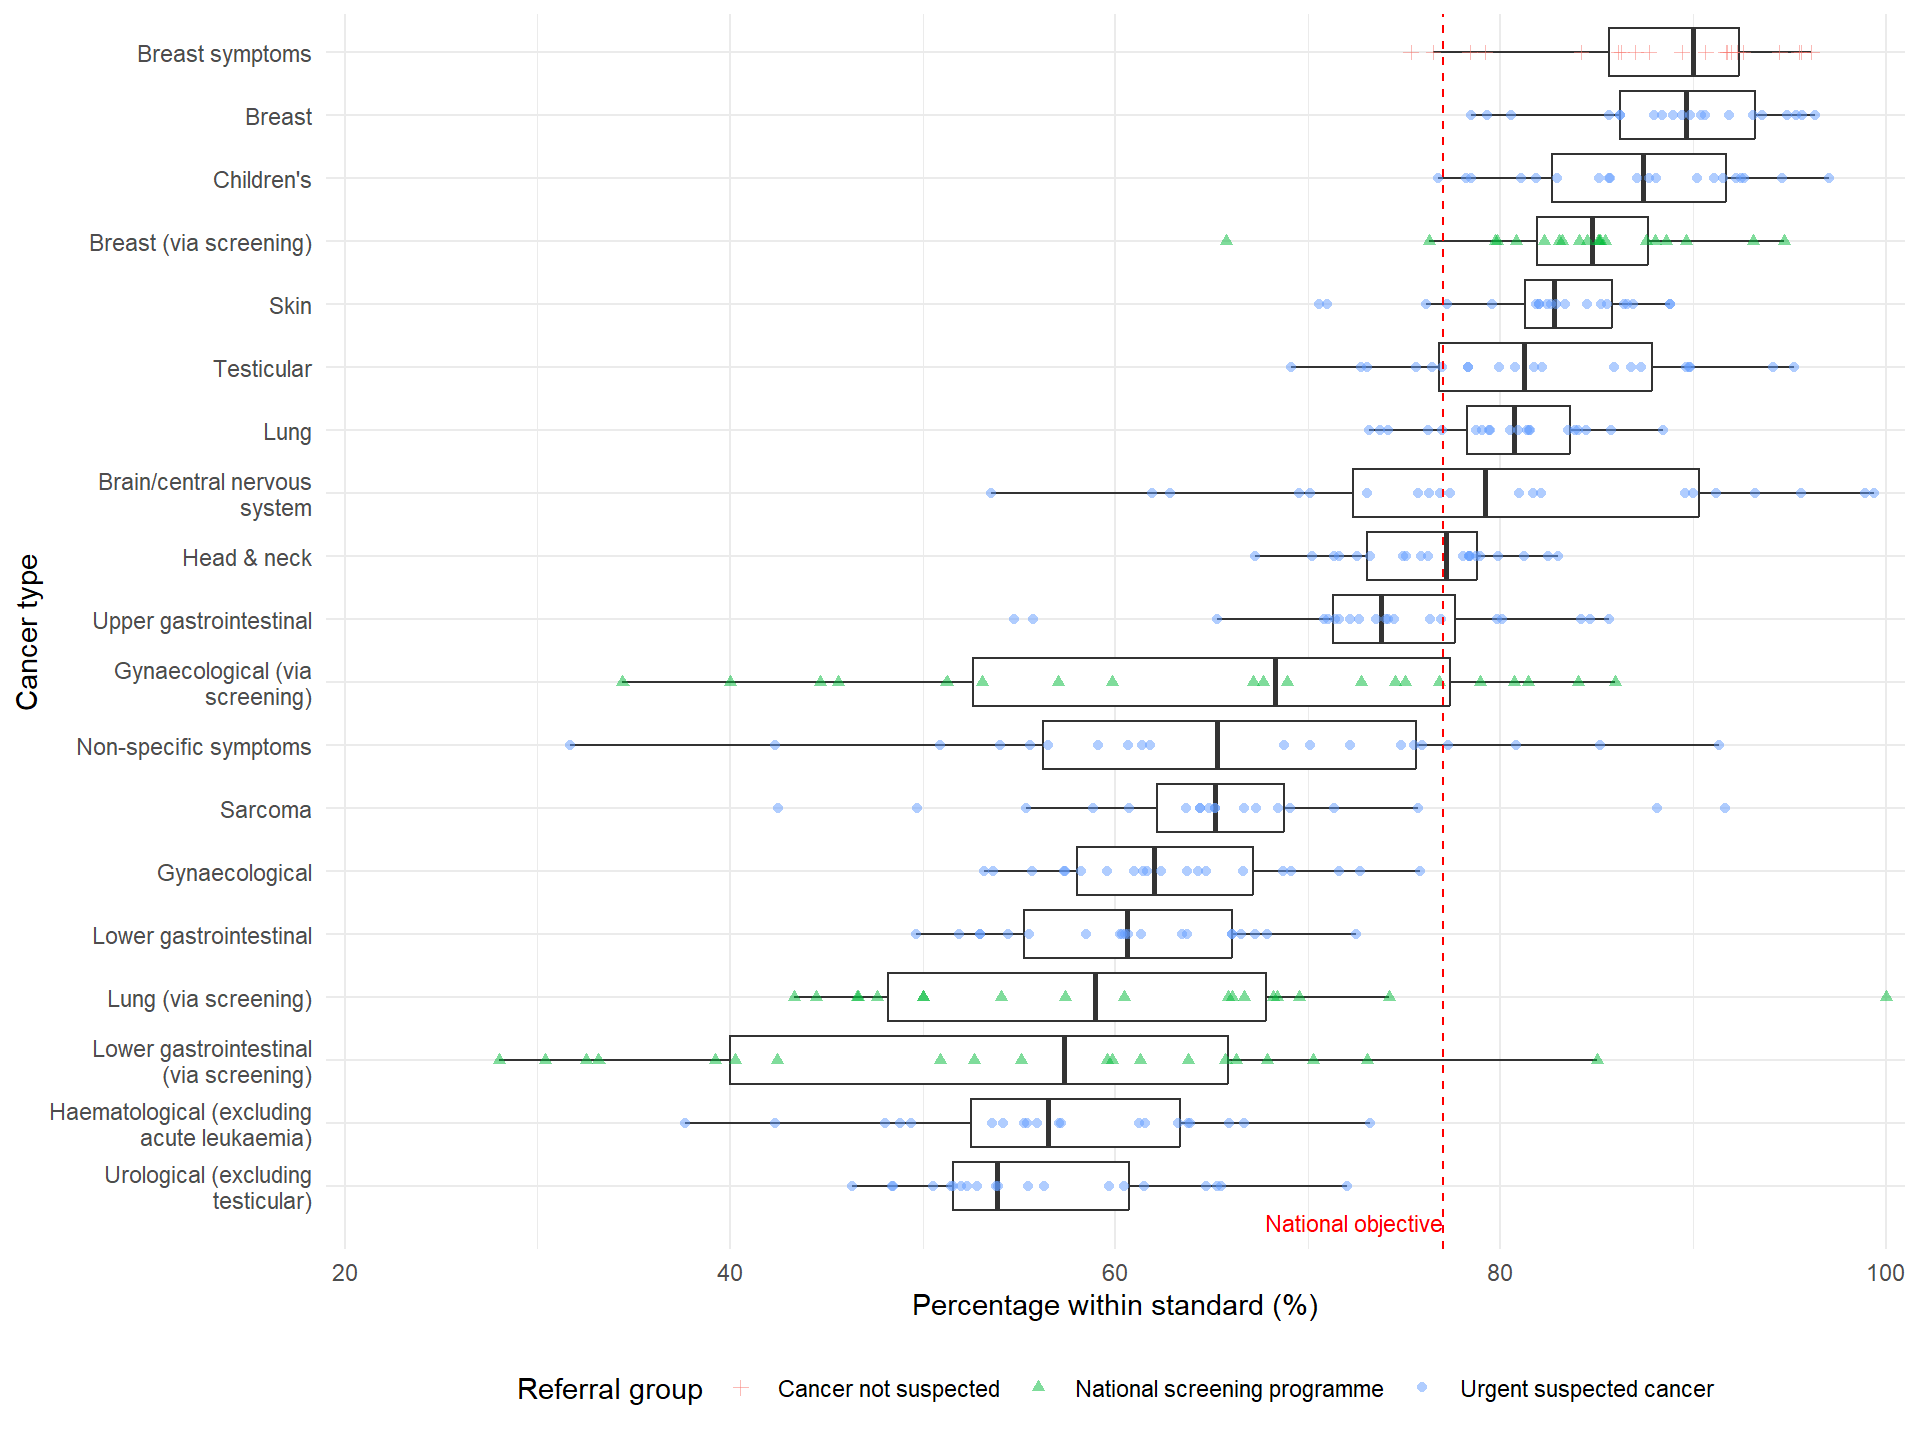
62-day treatment standard
Cancer type by referral group
Treatment modality by referral group