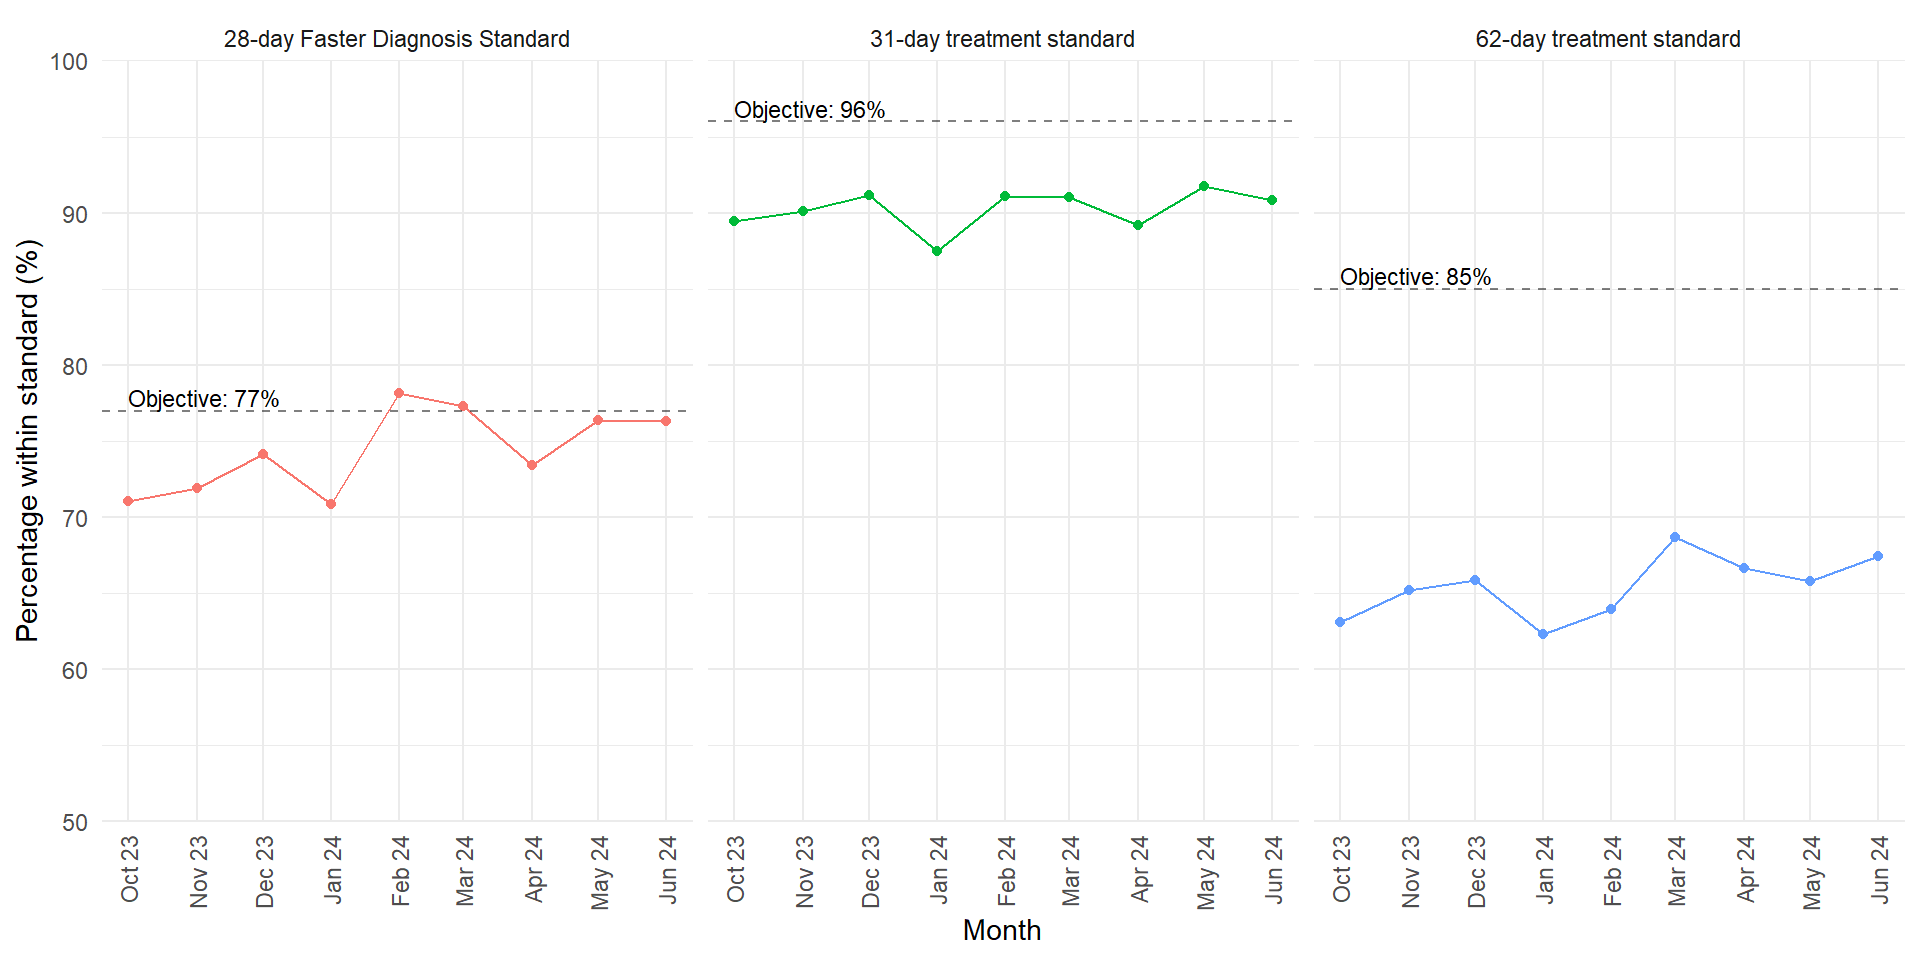
This page shows time trends in the percentages of patients within waiting times standards, nationally and by Cancer Alliance, since October 2023. Historic time trends in national performance are available here.
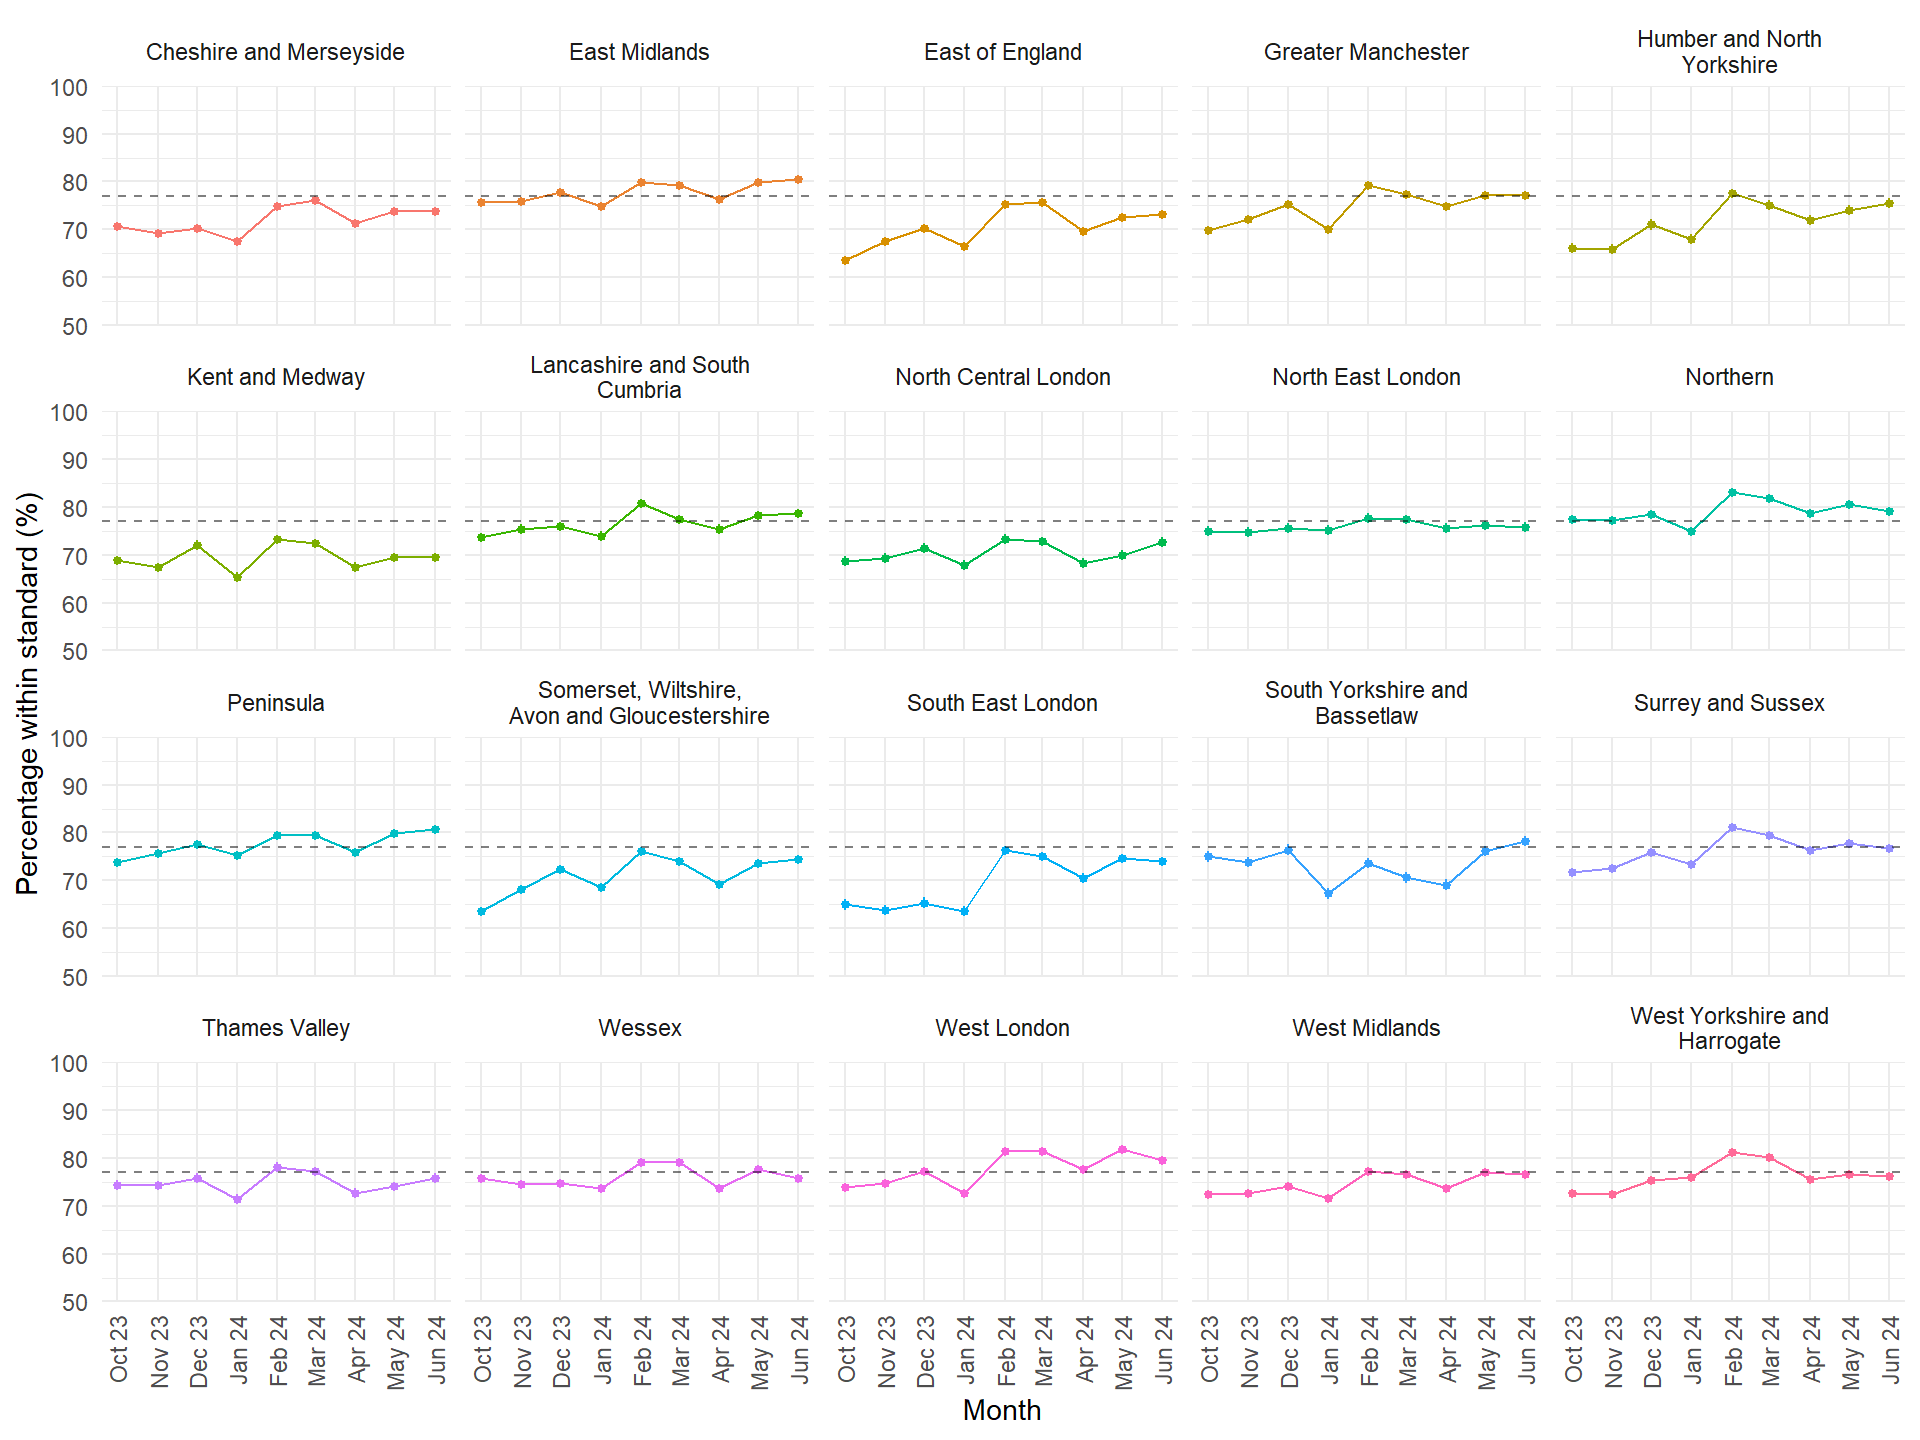
Figure 3: 28-day Faster Diagnosis Standard - Percentage of patients within standard over time, by Cancer Alliance. The dashed line at 80% indicates the national objective.
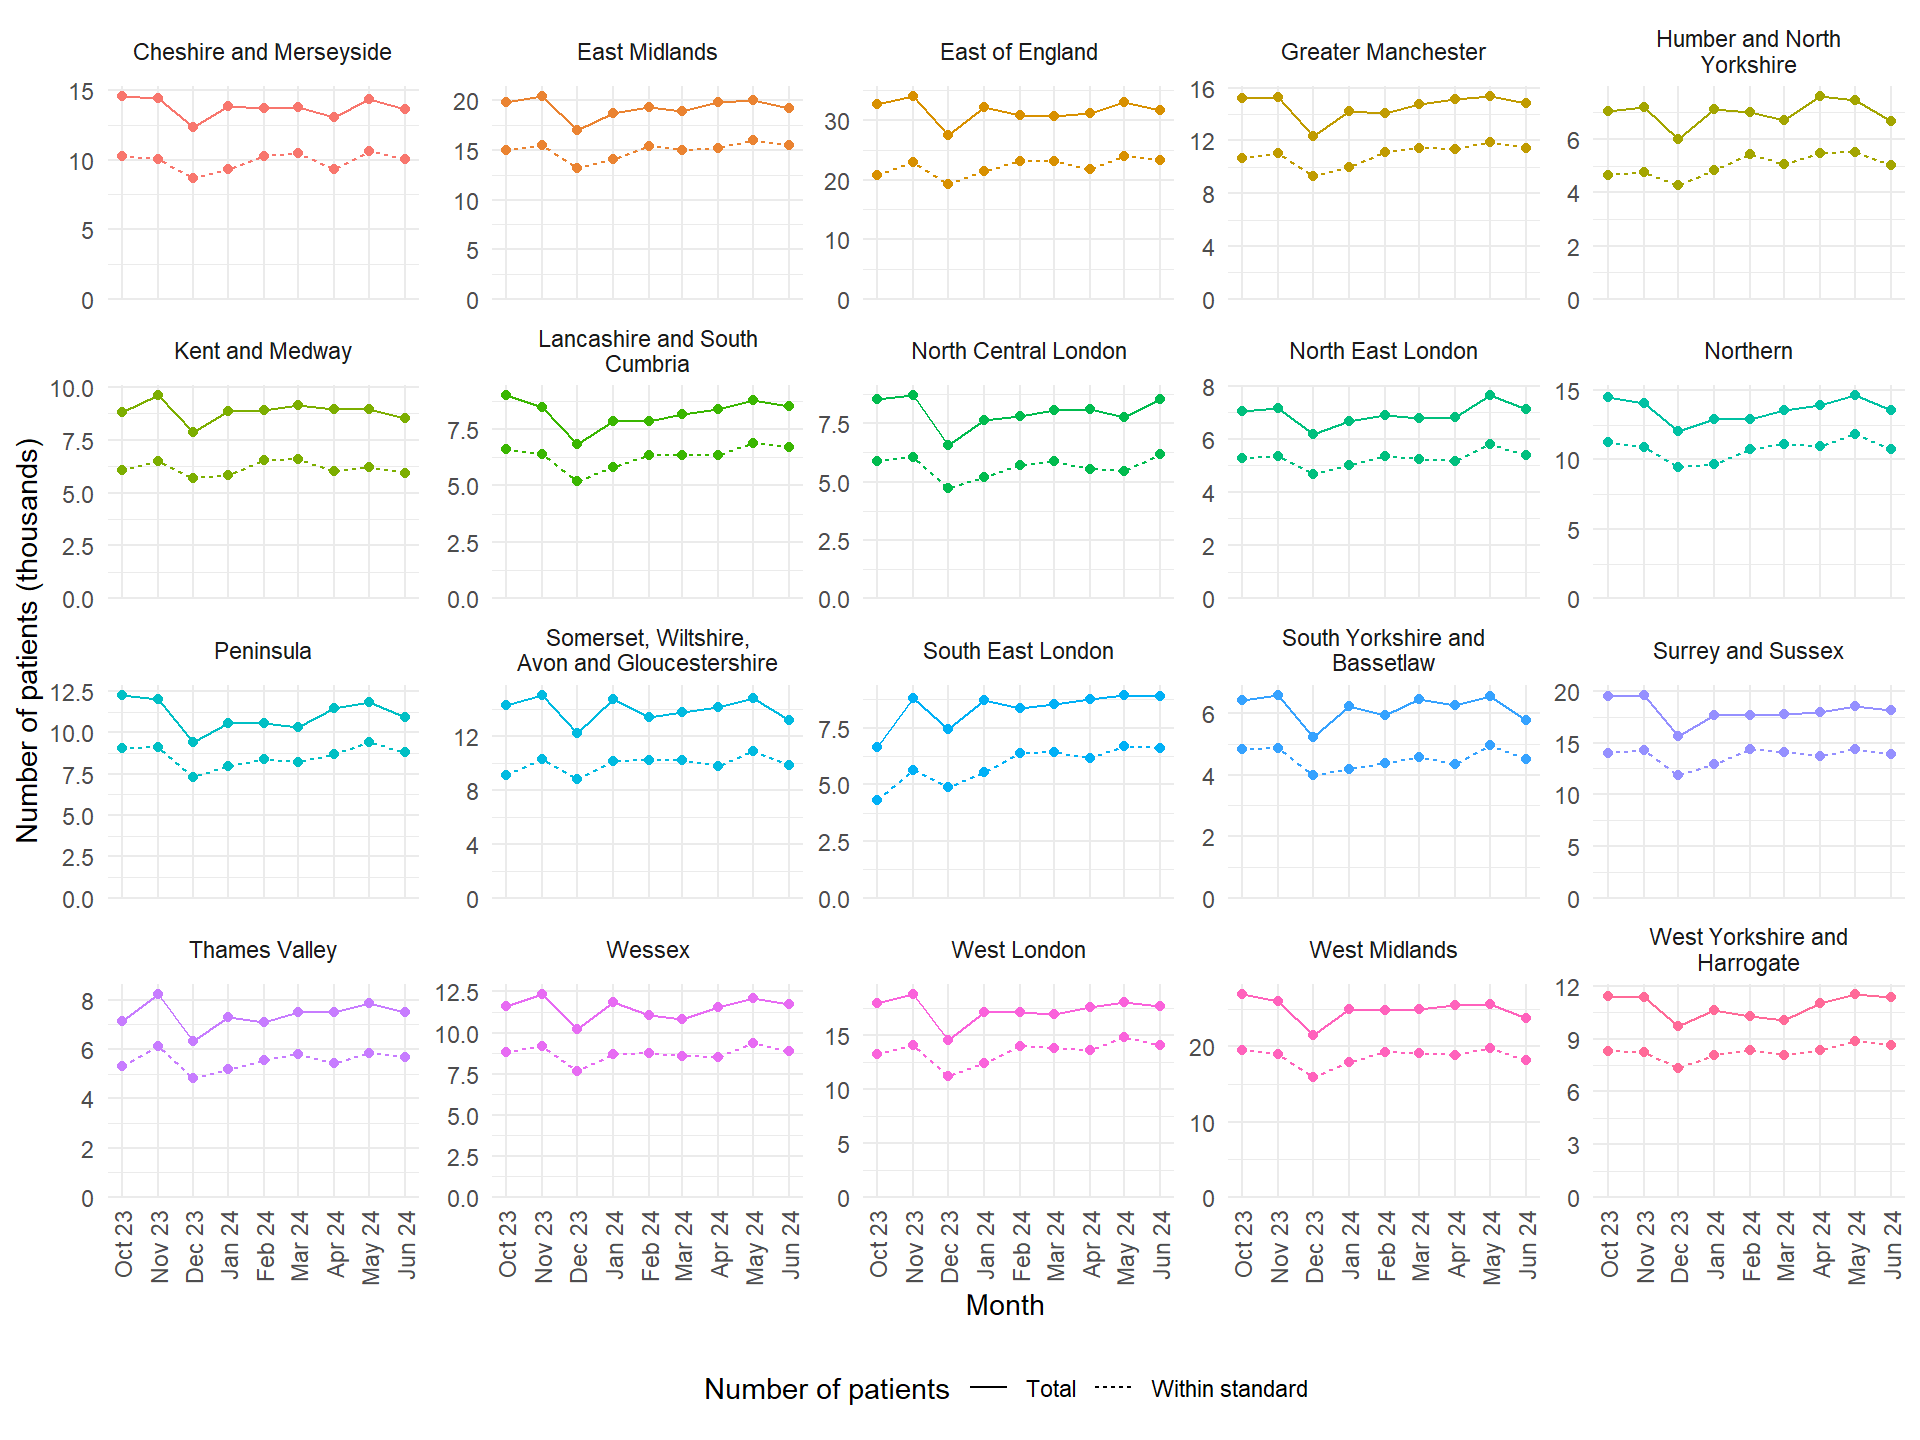
Figure 4: 28-day Faster Diagnosis Standard - Total number of patients (solid line) and the number within standard (dashed line) over time, by Cancer Alliance
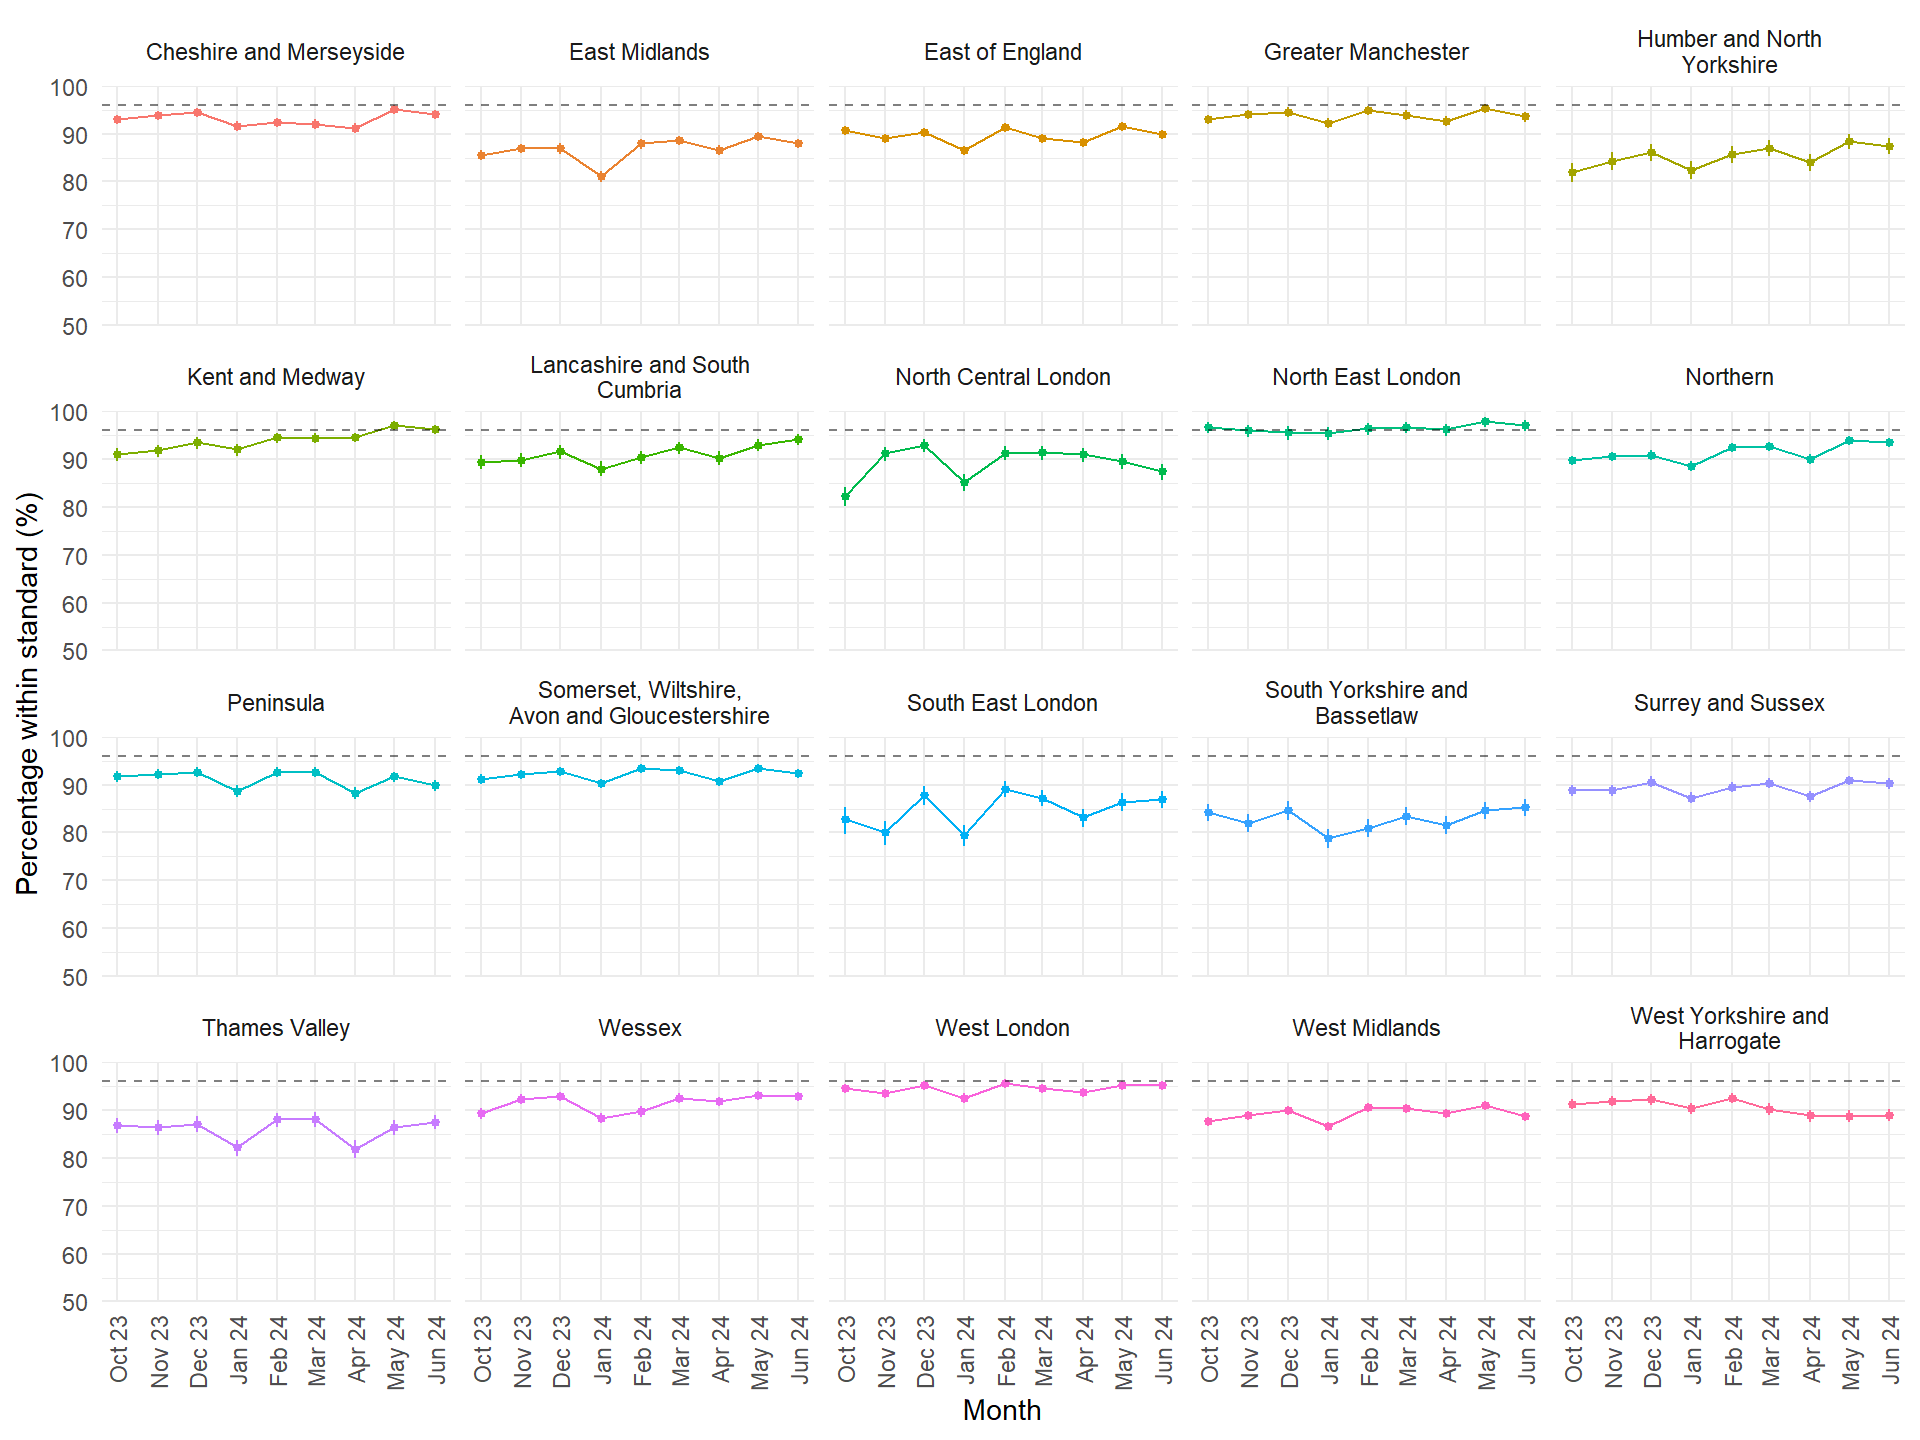
Figure 5: 31-day treatment standard - Percentage of patients within standard (and 95% confidence intervals) over time, by Cancer Alliance. The dashed line at 96% indicates the national objective.
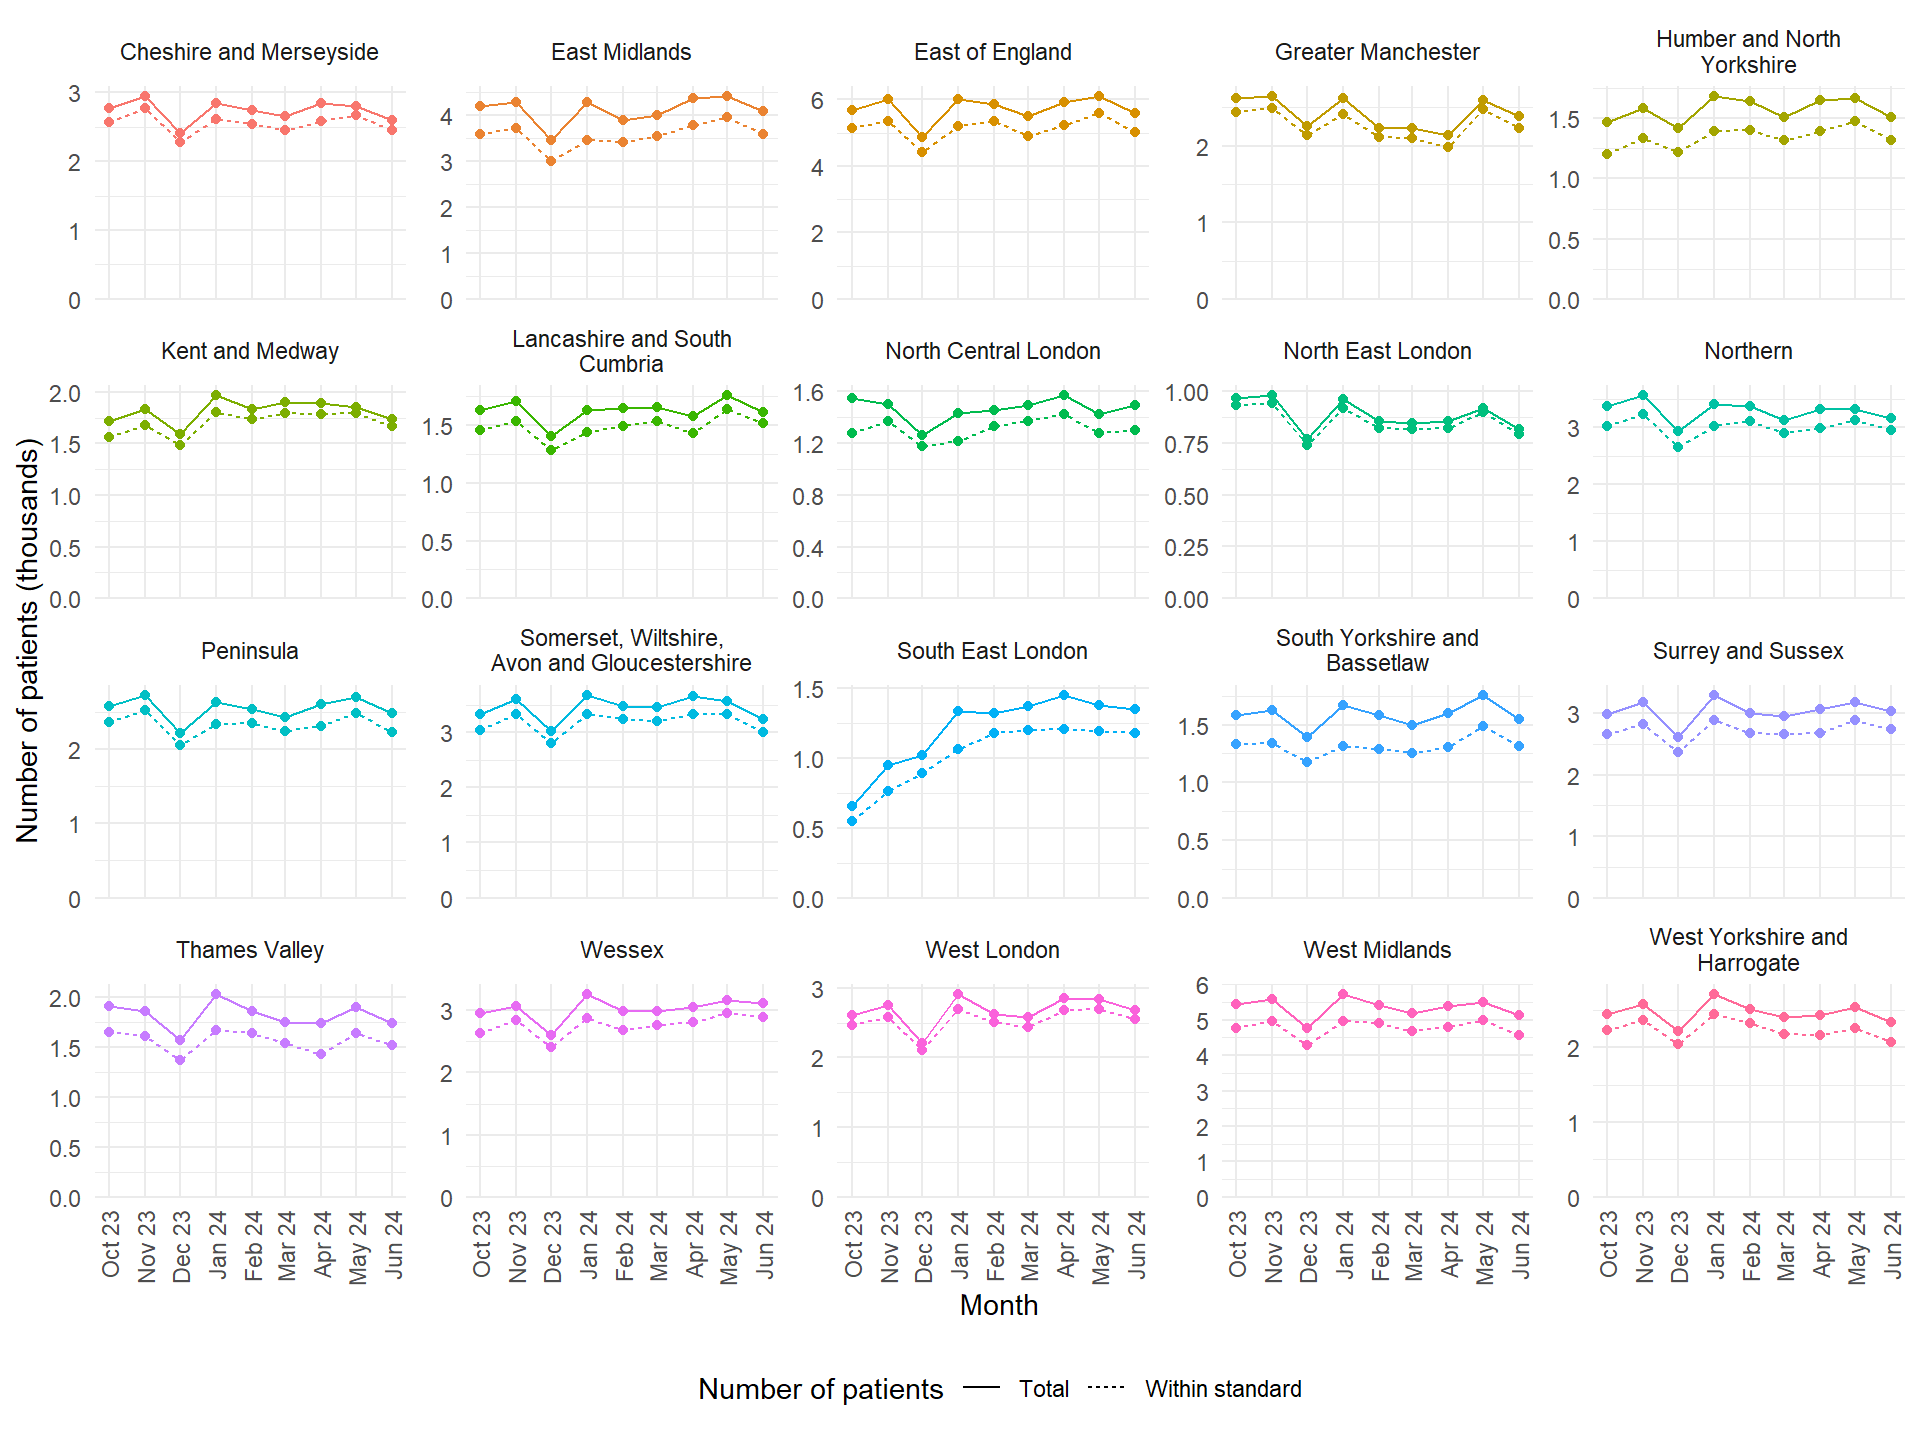
Figure 6: 31-day treatment standard - Total number of patients (solid line) and the number within standard (dashed line) over time, by Cancer Alliance
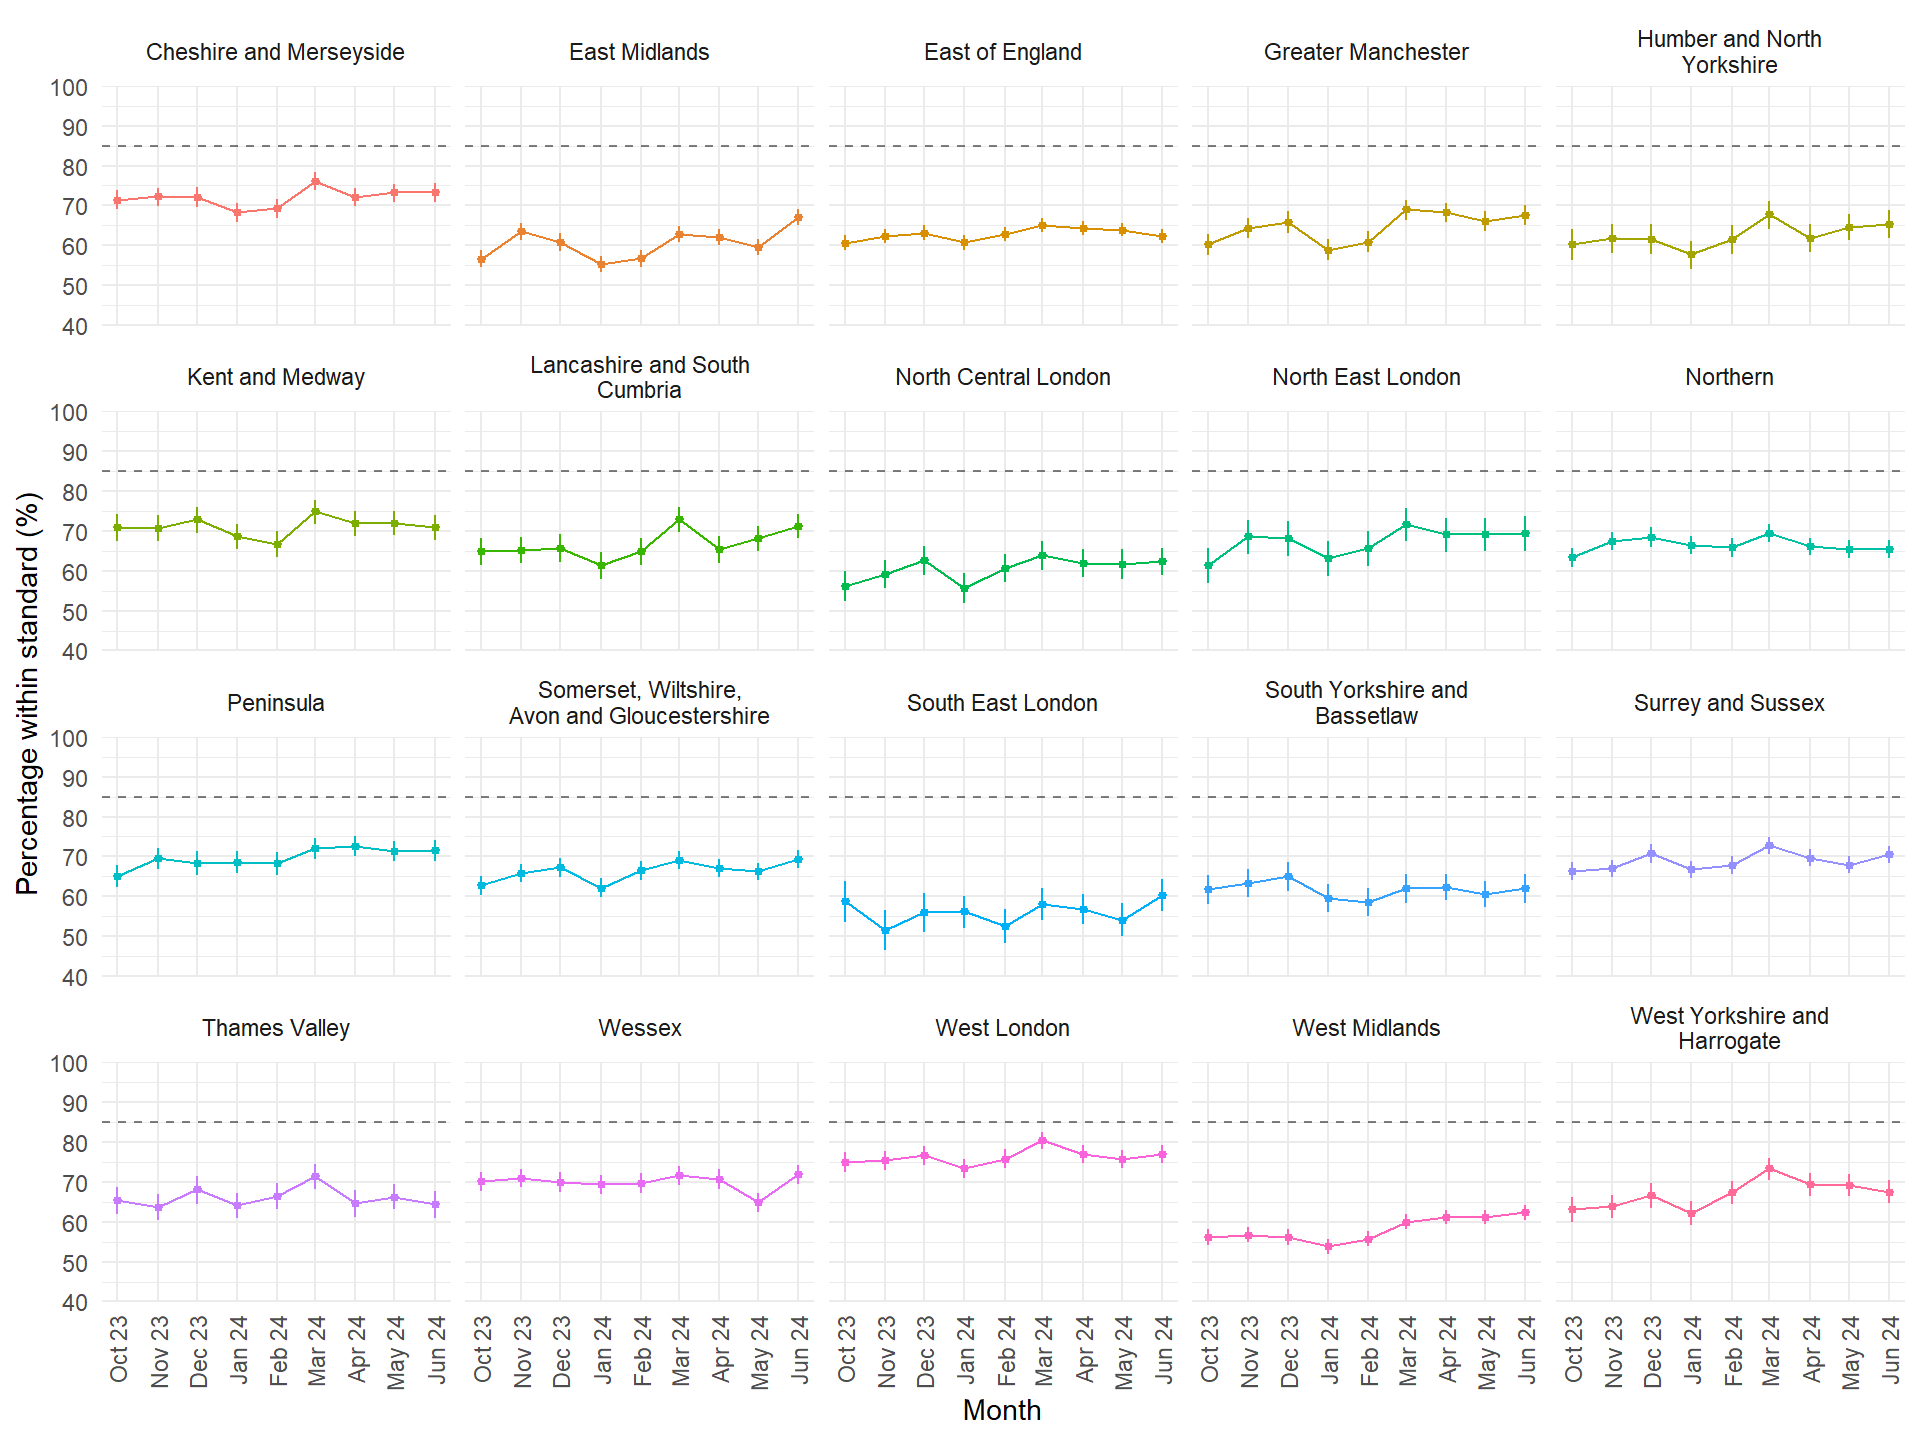
Figure 7: 62-day treatment standard - Percentage of patients within standard (and 95% confidence intervals) over time, by Cancer Alliance. The dashed line at 85% indicates the national objective.
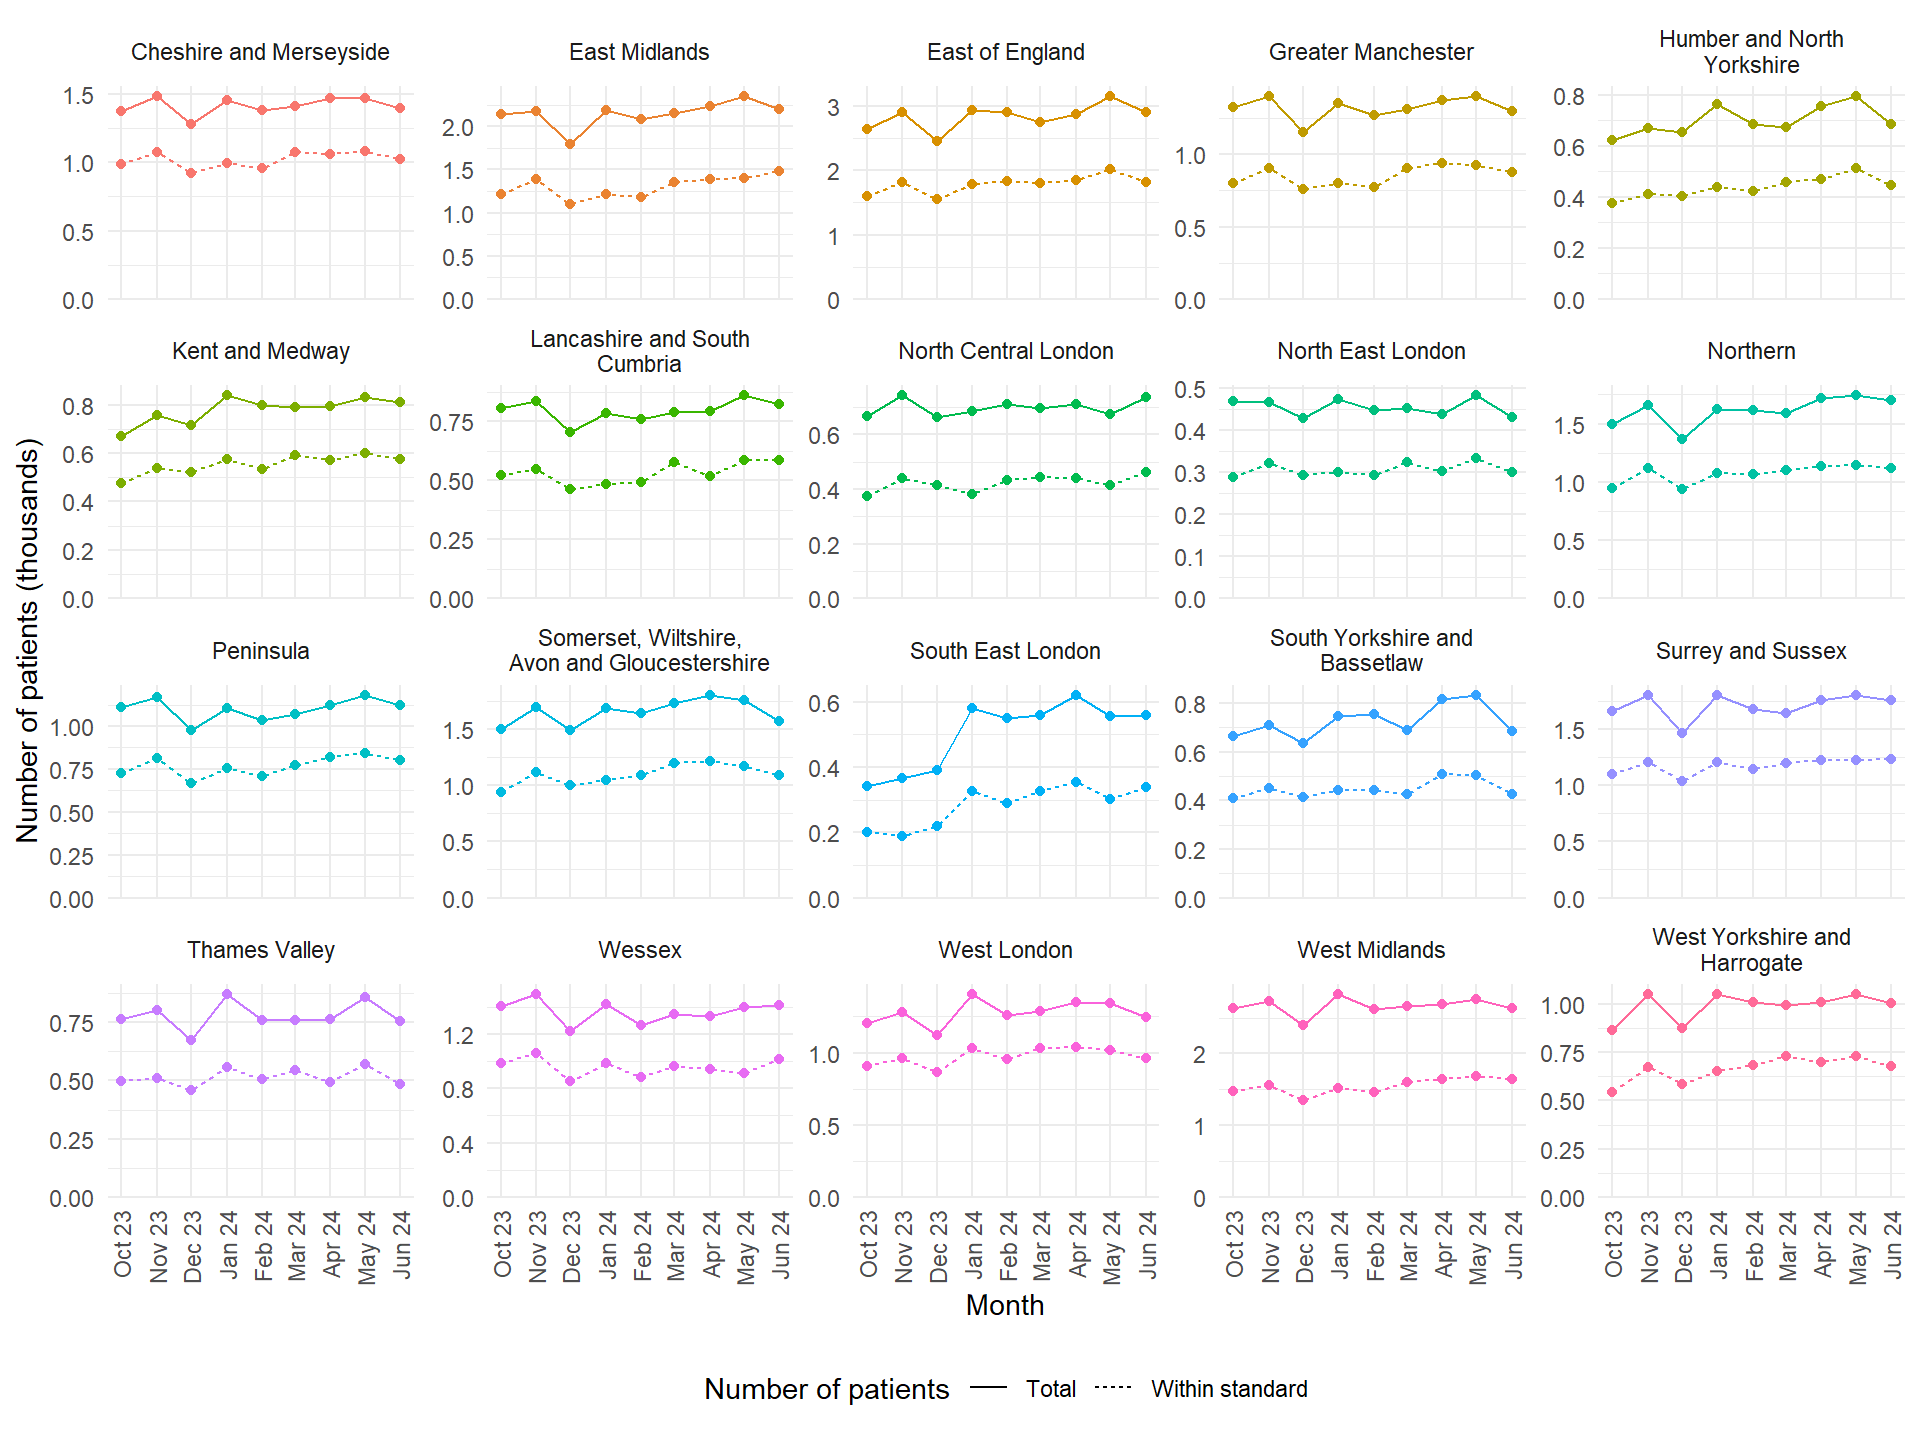
Figure 8: 62-day treatment standard - Total number of patients (solid line) and the number within standard (dashed line) over time, by Cancer Alliance