Prioritising regions and pathways to improve
This page shows the percentages of patients within waiting times standards and the percentages of all breaches accounted for, by each pathway in each Cancer Alliance. It highlights regions and pathways to improve.
Time period of data: October 2023 to February 2025
28-day Faster Diagnosis Standard
Reducing inequalities
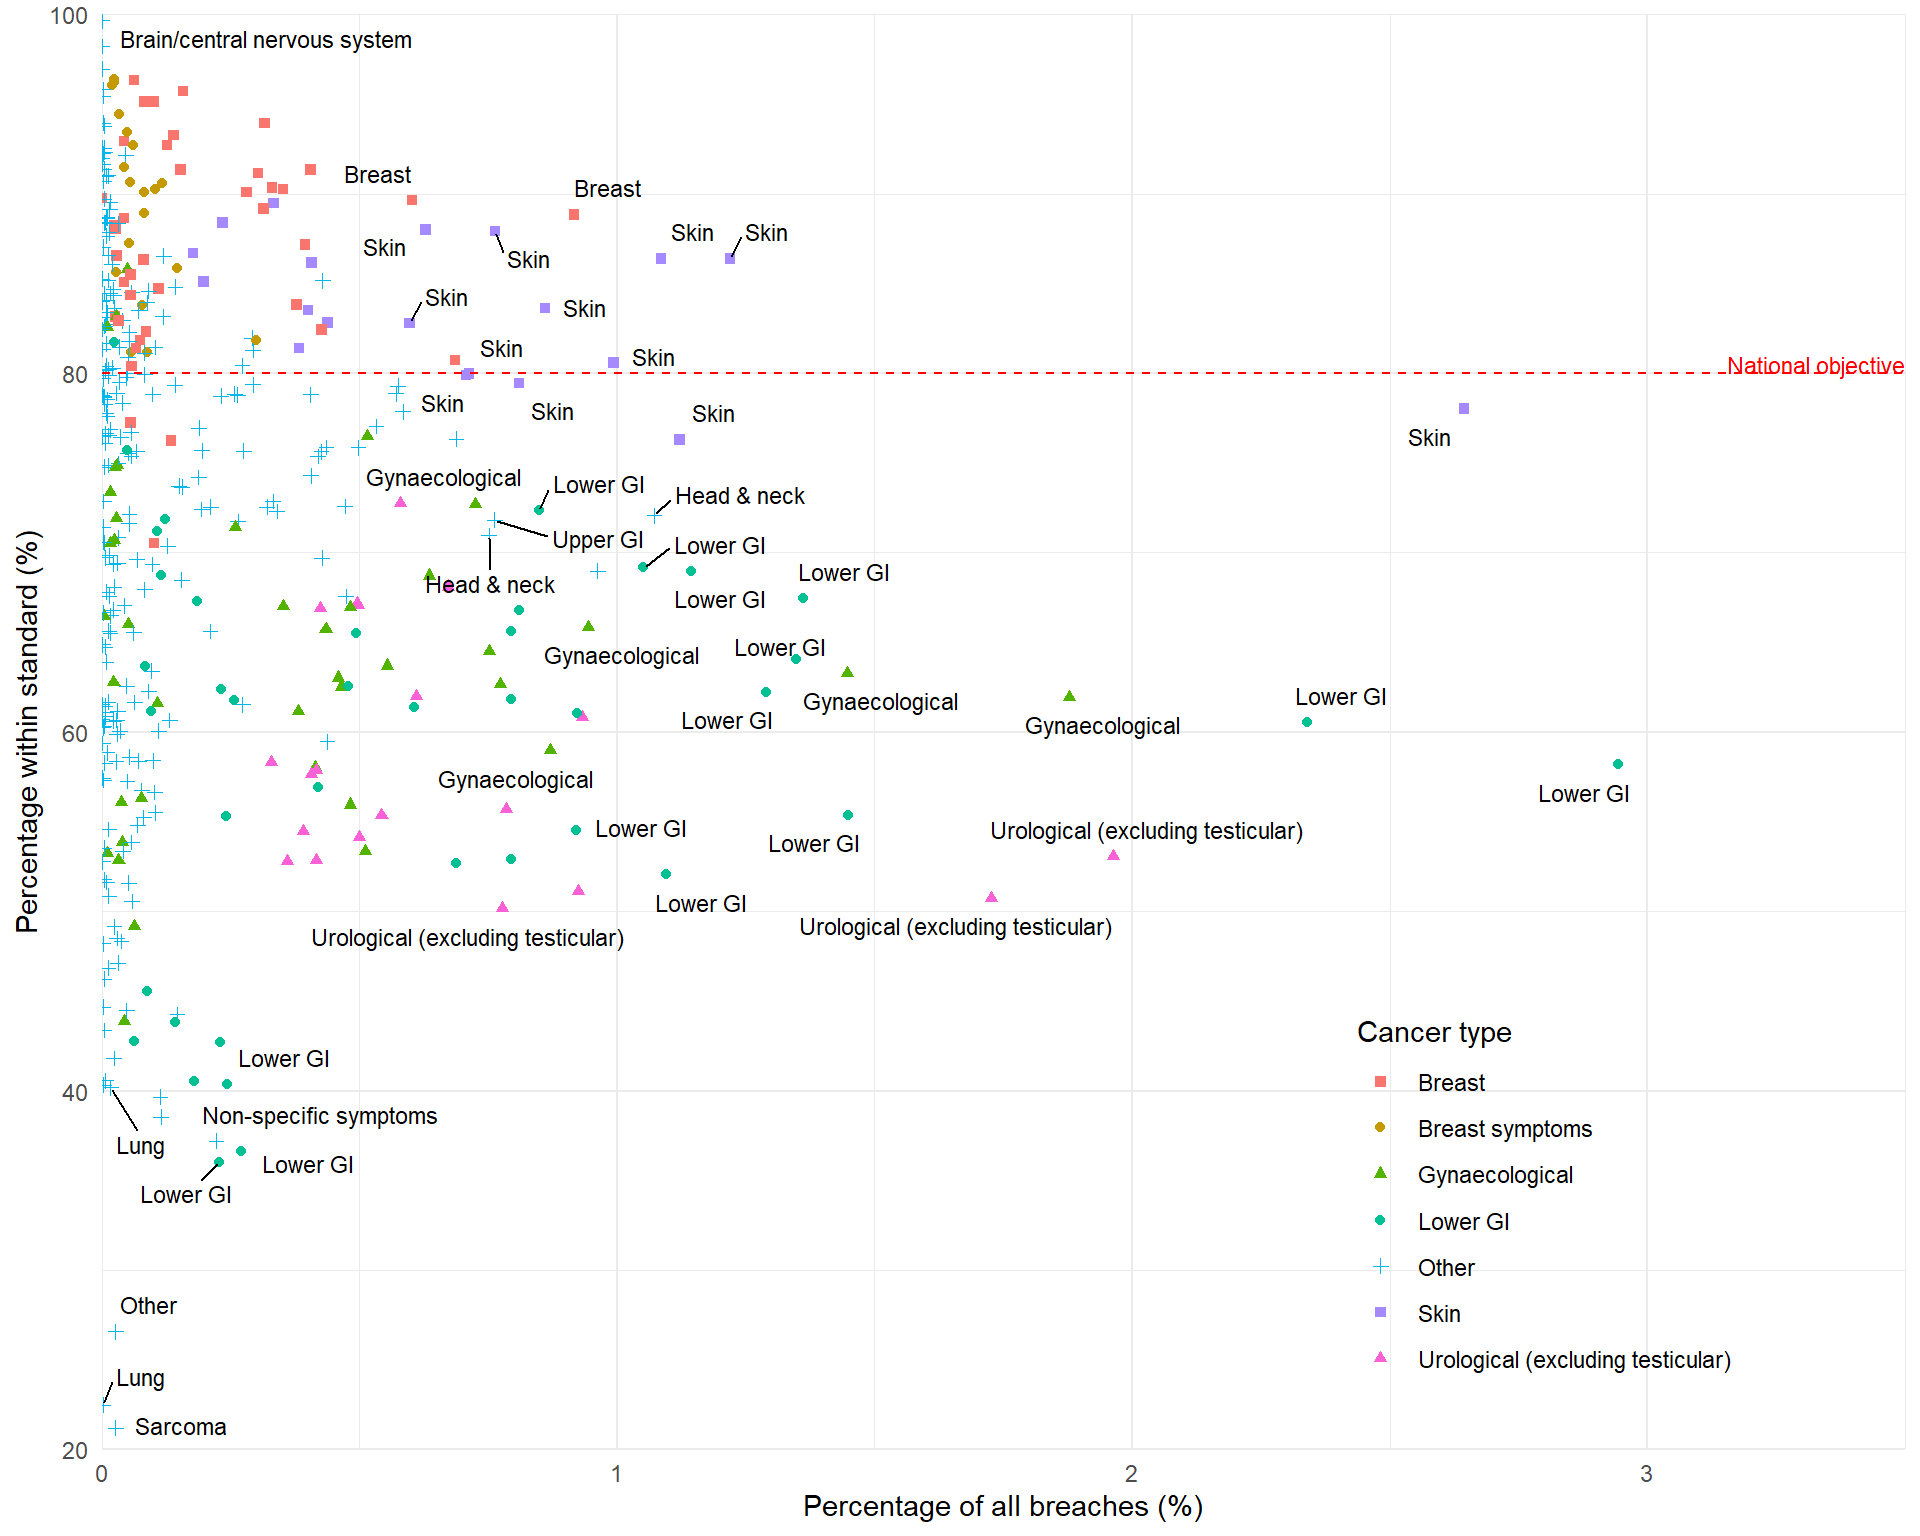
Figure 1 shows several regional pathways with low percentages of patients within the standard. Those in the lowest 2.5% of all pathways are:
| Cancer Alliance | Referral group | Cancer type | Percent within standard (%) | Total number of patients | Total number within standard | Total number of breaches | Percent of all breaches (%) | Cumulative percent of all breaches (%) |
|---|---|---|---|---|---|---|---|---|
| North East London | Urgent suspected cancer | Sarcoma | 21.20 | 382 | 81 | 301 | 0.03 | 0.03 |
| Thames Valley | National screening programme | Lung | 22.50 | 40 | 9 | 31 | 0.00 | 0.03 |
| North East London | Urgent suspected cancer | Other | 26.59 | 410 | 109 | 301 | 0.03 | 0.06 |
| Lancashire and South Cumbria | National screening programme | Lower GI | 36.02 | 3973 | 1431 | 2542 | 0.23 | 0.28 |
| Greater Manchester | National screening programme | Lower GI | 36.62 | 4768 | 1746 | 3022 | 0.27 | 0.56 |
| Thames Valley | Urgent suspected cancer | Non-specific symptoms | 37.22 | 3947 | 1469 | 2478 | 0.22 | 0.78 |
| East Midlands | Urgent suspected cancer | Haematological (excluding acute leukaemia) | 38.54 | 2086 | 804 | 1282 | 0.11 | 0.89 |
| North East London | Urgent suspected cancer | Non-specific symptoms | 39.67 | 2095 | 831 | 1264 | 0.11 | 1.01 |
| East of England | National screening programme | Lung | 40.19 | 316 | 127 | 189 | 0.02 | 1.02 |
| South East London | National screening programme | Missing or invalid | 40.32 | 62 | 25 | 37 | 0.00 | 1.03 |
| Humber and North Yorkshire | National screening programme | Lower GI | 40.35 | 4555 | 1838 | 2717 | 0.24 | 1.27 |
These pathways may be good candidates for policies to reduce inequalities in waiting times.
However, Table 1 shows that these pathways account for only a small percentage of all breaches: the cumulative percentage of all breaches equals 1.27%.
Reducing numbers of breaches
The complementary approach is to improve pathways that account for the largest percentages of all breaches (towards the right of Figure 1).
The pathways with percentages of all breaches in the highest 2.5% of values are:
| Cancer Alliance | Referral group | Cancer type | Percent within standard (%) | Total number of patients | Total number within standard | Total number of breaches | Percent of all breaches (%) | Cumulative percent of all breaches (%) |
|---|---|---|---|---|---|---|---|---|
| East of England | Urgent suspected cancer | Lower GI | 58.18 | 78487 | 45667 | 32820 | 2.94 | 2.94 |
| East of England | Urgent suspected cancer | Skin | 78.01 | 134052 | 104574 | 29478 | 2.64 | 5.59 |
| West Midlands | Urgent suspected cancer | Lower GI | 60.56 | 66136 | 40049 | 26087 | 2.34 | 7.93 |
| East of England | Urgent suspected cancer | Urological (excluding testicular) | 53.07 | 46639 | 24752 | 21887 | 1.96 | 9.89 |
| East of England | Urgent suspected cancer | Gynaecological | 61.96 | 55031 | 34096 | 20935 | 1.88 | 11.77 |
| West Midlands | Urgent suspected cancer | Urological (excluding testicular) | 50.75 | 39060 | 19822 | 19238 | 1.73 | 13.49 |
| Cheshire and Merseyside | Urgent suspected cancer | Lower GI | 55.34 | 36167 | 20016 | 16151 | 1.45 | 14.94 |
| West Midlands | Urgent suspected cancer | Gynaecological | 63.27 | 43929 | 27795 | 16134 | 1.45 | 16.39 |
| Surrey and Sussex | Urgent suspected cancer | Lower GI | 67.44 | 46627 | 31444 | 15183 | 1.36 | 17.75 |
| East Midlands | Urgent suspected cancer | Lower GI | 64.03 | 41795 | 26763 | 15032 | 1.35 | 19.10 |
| Somerset, Wiltshire, Avon and Gloucestershire | Urgent suspected cancer | Lower GI | 62.22 | 38059 | 23679 | 14380 | 1.29 | 20.39 |
These 11 pathways account for 20.39% of all breaches. Improving these pathways could have a larger impact on overall performance nationally.
31-day treatment standard
Reducing inequalities
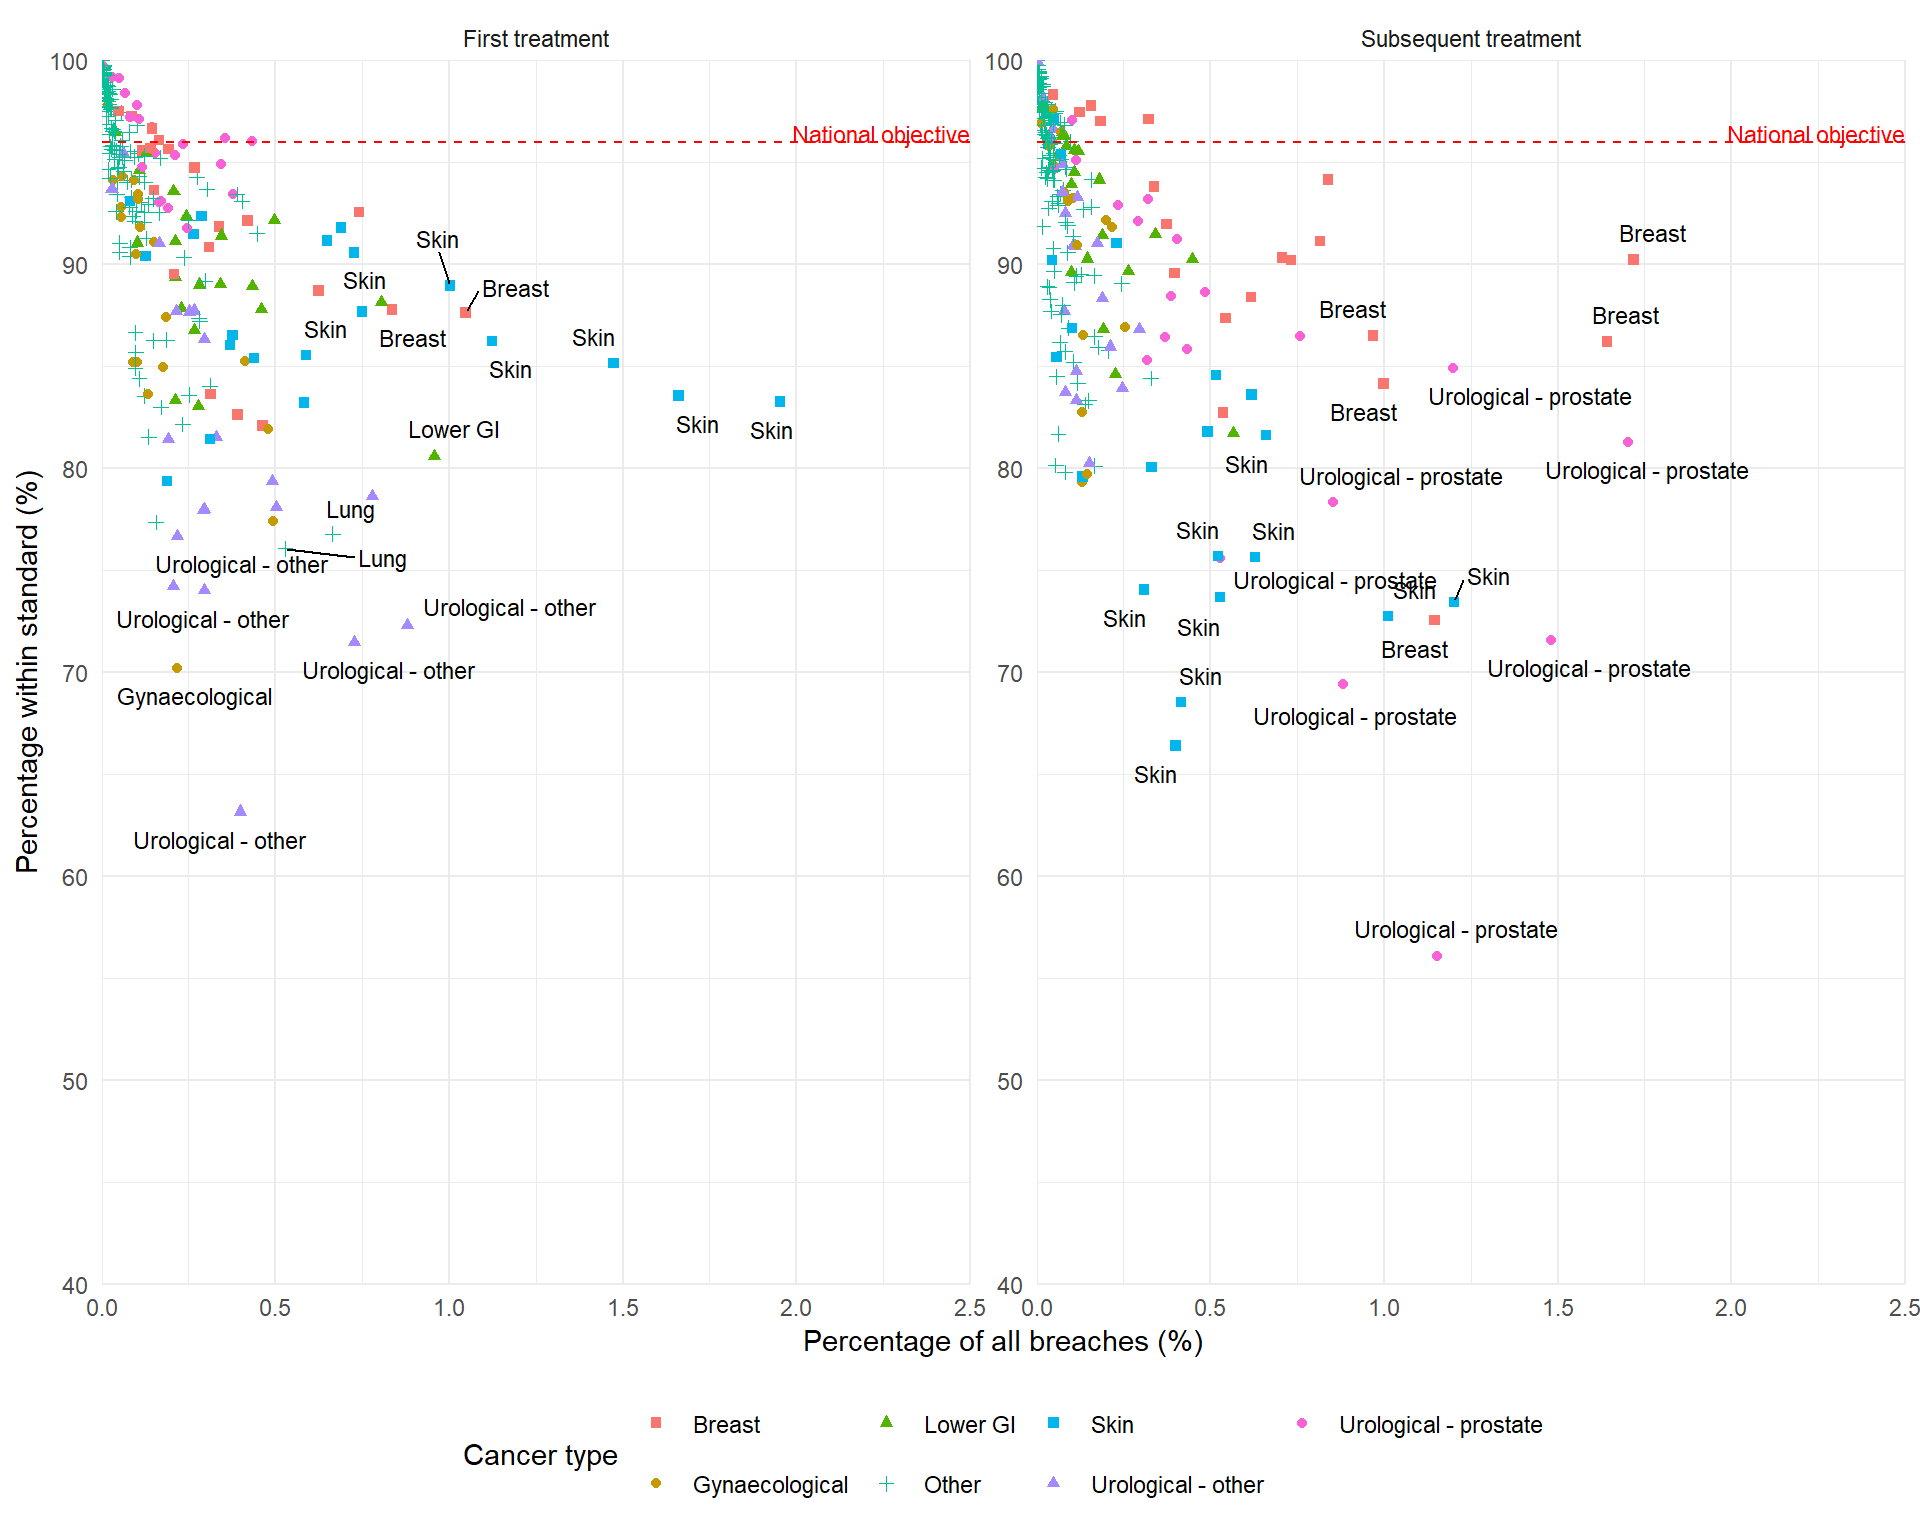
Figure 2 shows several regional pathways with low percentages of patients within the standard. Those in the lowest 2.5% of all pathways are:
| Cancer Alliance | First or subsequent treatment | Cancer type | Percent within standard (%) | Total number of patients | Total number within standard | Total number of breaches | Percent of all breaches (%) | Cumulative percent of all breaches (%) |
|---|---|---|---|---|---|---|---|---|
| South Yorkshire and Bassetlaw | Subsequent treatment | Urological - prostate | 56.10 | 2296 | 1288 | 1008 | 1.15 | 1.15 |
| South Yorkshire and Bassetlaw | First treatment | Urological - other | 63.17 | 945 | 597 | 348 | 0.40 | 1.55 |
| Lancashire and South Cumbria | Subsequent treatment | Skin | 66.41 | 1042 | 692 | 350 | 0.40 | 1.95 |
| South Yorkshire and Bassetlaw | Subsequent treatment | Skin | 68.54 | 1154 | 791 | 363 | 0.42 | 2.37 |
| North Central London | Subsequent treatment | Urological - prostate | 69.42 | 2518 | 1748 | 770 | 0.88 | 3.25 |
| Thames Valley | First treatment | Gynaecological | 70.22 | 638 | 448 | 190 | 0.22 | 3.47 |
| East Midlands | First treatment | Urological - other | 71.49 | 2227 | 1592 | 635 | 0.73 | 4.19 |
| Northern | Subsequent treatment | Urological - prostate | 71.61 | 4561 | 3266 | 1295 | 1.48 | 5.67 |
| West Midlands | First treatment | Urological - other | 72.33 | 2776 | 2008 | 768 | 0.88 | 6.55 |
| Humber and North Yorkshire | Subsequent treatment | Breast | 72.55 | 3647 | 2646 | 1001 | 1.15 | 7.70 |
| East of England | Subsequent treatment | Skin | 72.75 | 3248 | 2363 | 885 | 1.01 | 8.71 |
| West Midlands | Subsequent treatment | Skin | 73.45 | 3958 | 2907 | 1051 | 1.20 | 9.91 |
| Thames Valley | Subsequent treatment | Skin | 73.69 | 1752 | 1291 | 461 | 0.53 | 10.44 |
These pathways may be good candidates for policies to reduce inequalities in cancer waiting times.
However, Table 3 shows that these pathways account for only a small proportion of all breaches: the cumulative percentage of all breaches equals 10.44%.
Reducing numbers of breaches
The complementary approach is to improve pathways that account for the largest percentages of all breaches (towards the right of Figure 2).
The pathways with percentages of all breaches in the highest 2.5% of values are:
| Cancer Alliance | First or subsequent treatment | Cancer type | Percent within standard (%) | Total number of patients | Total number within standard | Total number of breaches | Percent of all breaches (%) | Cumulative percent of all breaches (%) |
|---|---|---|---|---|---|---|---|---|
| East of England | First treatment | Skin | 83.28 | 10210 | 8503 | 1707 | 1.95 | 1.95 |
| East of England | Subsequent treatment | Breast | 90.23 | 15378 | 13876 | 1502 | 1.72 | 3.67 |
| East of England | Subsequent treatment | Urological - prostate | 81.31 | 7960 | 6472 | 1488 | 1.70 | 5.37 |
| West Midlands | First treatment | Skin | 83.58 | 8844 | 7392 | 1452 | 1.66 | 7.03 |
| East Midlands | Subsequent treatment | Breast | 86.23 | 10428 | 8992 | 1436 | 1.64 | 8.68 |
| Northern | Subsequent treatment | Urological - prostate | 71.61 | 4561 | 3266 | 1295 | 1.48 | 10.16 |
| Surrey and Sussex | First treatment | Skin | 85.16 | 8684 | 7395 | 1289 | 1.47 | 11.63 |
| West Midlands | Subsequent treatment | Skin | 73.45 | 3958 | 2907 | 1051 | 1.20 | 12.84 |
| West Midlands | Subsequent treatment | Urological - prostate | 84.92 | 6954 | 5905 | 1049 | 1.20 | 14.04 |
| South Yorkshire and Bassetlaw | Subsequent treatment | Urological - prostate | 56.10 | 2296 | 1288 | 1008 | 1.15 | 15.19 |
| Humber and North Yorkshire | Subsequent treatment | Breast | 72.55 | 3647 | 2646 | 1001 | 1.15 | 16.33 |
| Somerset, Wiltshire, Avon and Gloucestershire | First treatment | Skin | 86.24 | 7136 | 6154 | 982 | 1.12 | 17.46 |
| West Midlands | First treatment | Breast | 87.65 | 7415 | 6499 | 916 | 1.05 | 18.50 |
These 13 pathways account for 18.5% of all breaches. Improving these pathways could have a larger impact on overall performance nationally.
62-day treatment standard
Reducing inequalities
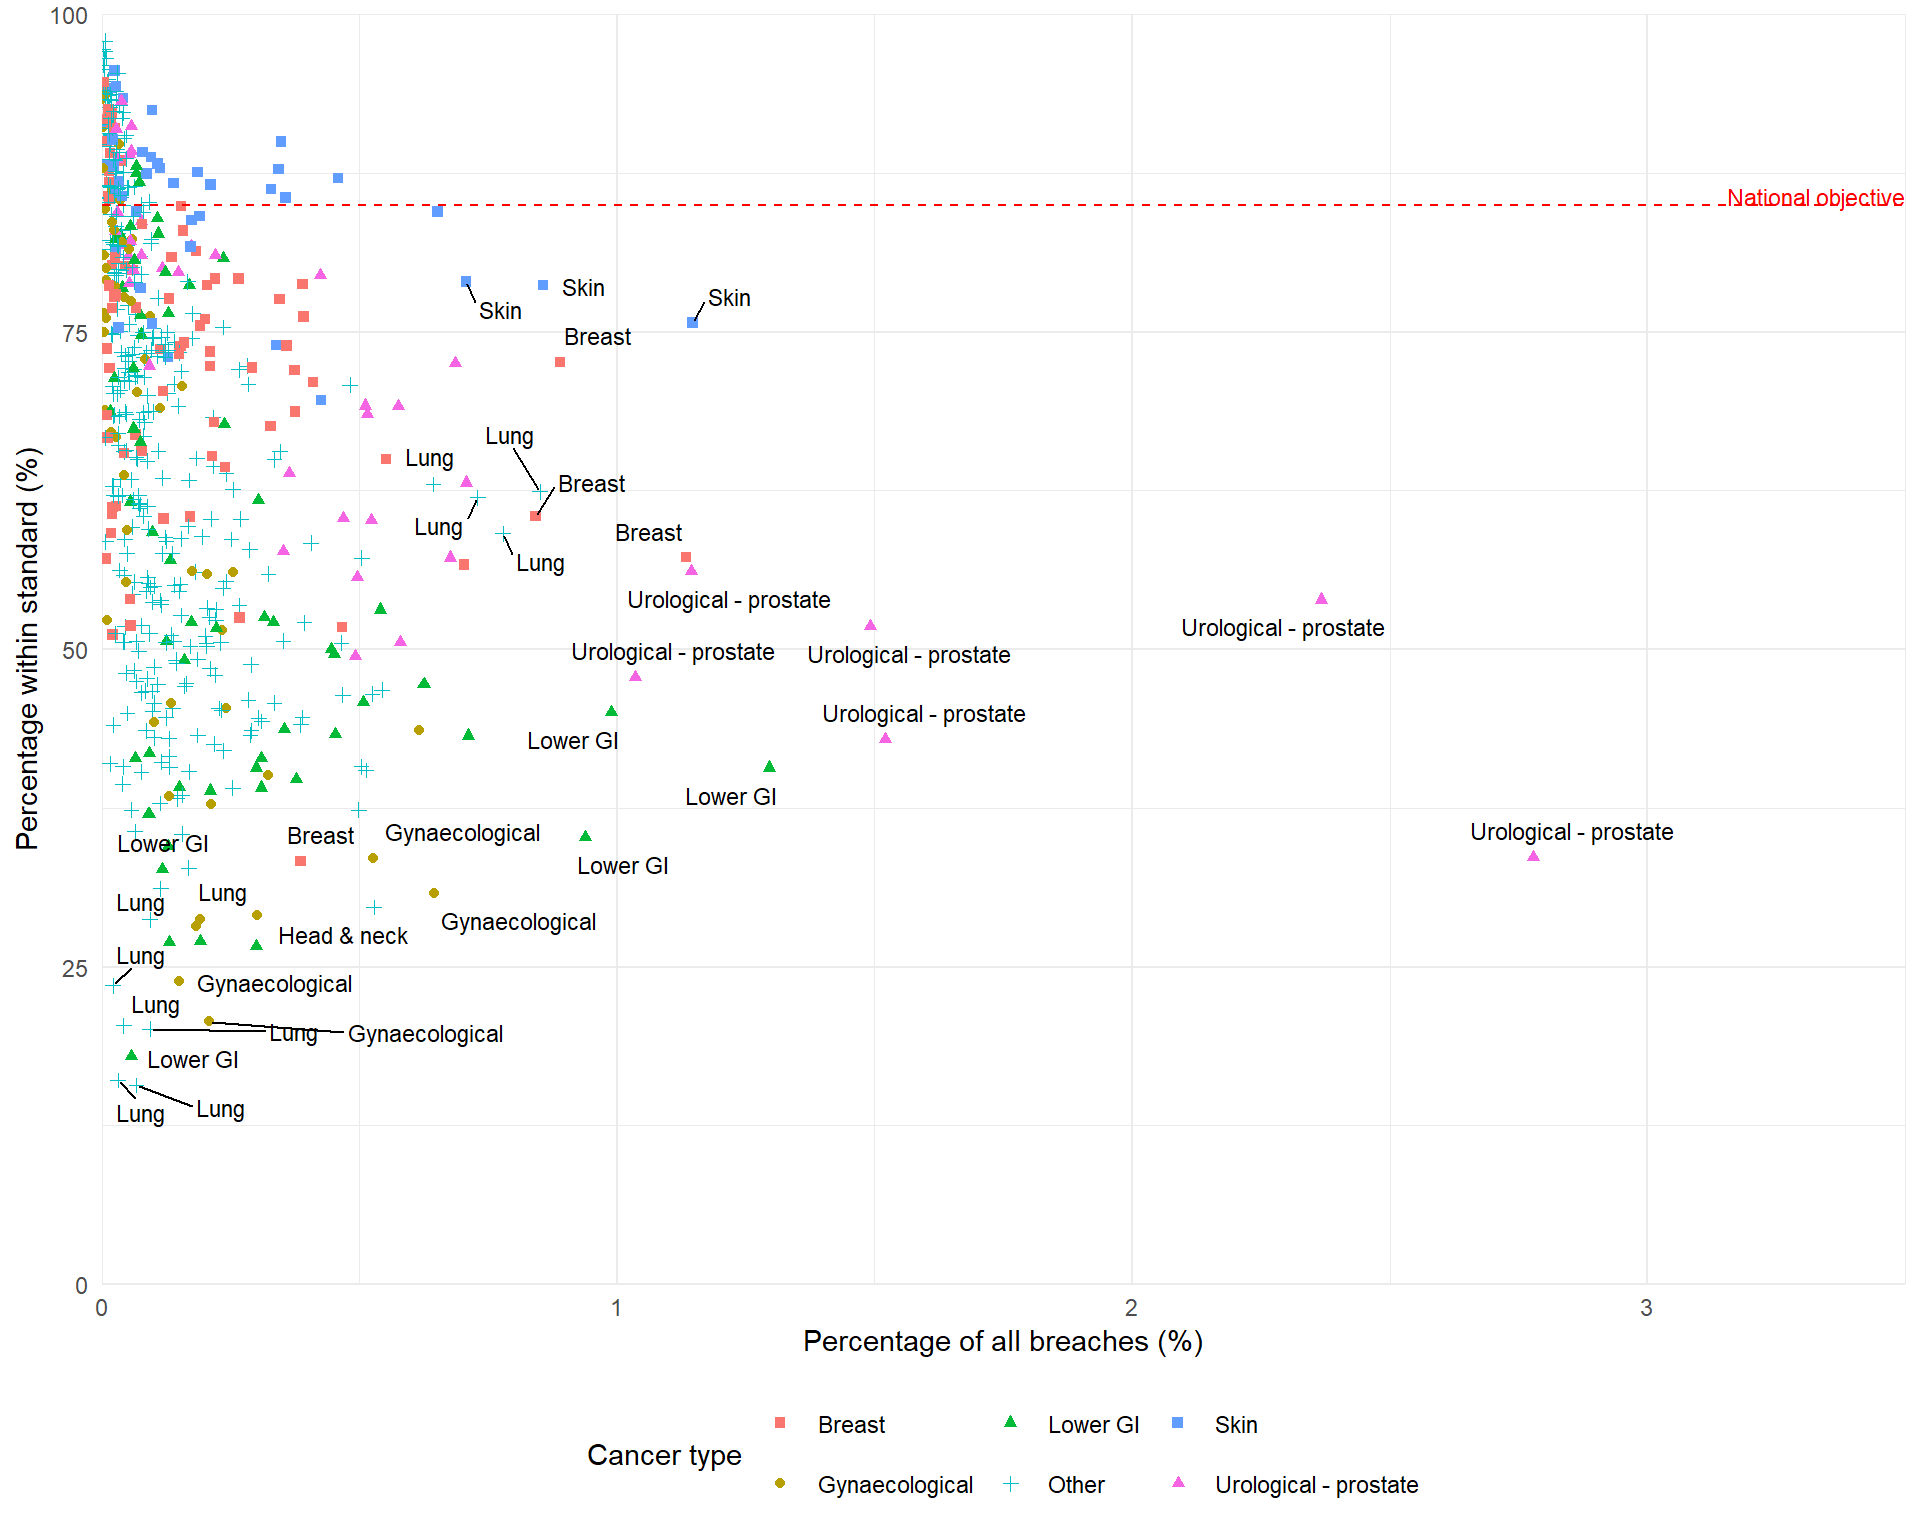
Figure 3 shows several regional pathways with low percentages of patients within the standard. Those in the lowest 2.5% of all pathways are:
| Cancer Alliance | Referral group | Cancer type | Percent within standard (%) | Total number of patients | Total number within standard | Total number of breaches | Percent of all breaches (%) | Cumulative percent of all breaches (%) |
|---|---|---|---|---|---|---|---|---|
| East of England | Screening | Lung | 15.68 | 118.0 | 18.5 | 99.5 | 0.07 | 0.07 |
| Humber and North Yorkshire | Screening | Lung | 16.07 | 56.0 | 9.0 | 47.0 | 0.03 | 0.10 |
| South East London | Screening | Lower GI | 17.96 | 103.0 | 18.5 | 84.5 | 0.06 | 0.15 |
| Peninsula | Screening | Lung | 20.11 | 174.0 | 35.0 | 139.0 | 0.09 | 0.25 |
| South East London | Screening | Lung | 20.38 | 78.5 | 16.0 | 62.5 | 0.04 | 0.29 |
| Thames Valley | Urgent suspected cancer | Gynaecological | 20.69 | 391.5 | 81.0 | 310.5 | 0.21 | 0.50 |
| Surrey and Sussex | Screening | Lung | 23.53 | 42.5 | 10.0 | 32.5 | 0.02 | 0.52 |
| South East London | Urgent suspected cancer | Gynaecological | 23.90 | 295.0 | 70.5 | 224.5 | 0.15 | 0.67 |
| East Midlands | Screening | Lower GI | 26.62 | 610.5 | 162.5 | 448.0 | 0.30 | 0.97 |
| Peninsula | Screening | Lower GI | 26.92 | 267.5 | 72.0 | 195.5 | 0.13 | 1.10 |
| Somerset, Wiltshire, Avon and Gloucestershire | Screening | Lower GI | 26.99 | 389.0 | 105.0 | 284.0 | 0.19 | 1.29 |
| Humber and North Yorkshire | Urgent suspected cancer | Gynaecological | 28.19 | 379.5 | 107.0 | 272.5 | 0.18 | 1.47 |
| Northern | Screening | Lung | 28.72 | 195.0 | 56.0 | 139.0 | 0.09 | 1.57 |
| South Yorkshire and Bassetlaw | Urgent suspected cancer | Gynaecological | 28.73 | 402.0 | 115.5 | 286.5 | 0.19 | 1.76 |
| Cheshire and Merseyside | Urgent suspected cancer | Gynaecological | 29.09 | 636.0 | 185.0 | 451.0 | 0.30 | 2.06 |
| West Midlands | Urgent suspected cancer | Head & neck | 29.69 | 1121.5 | 333.0 | 788.5 | 0.53 | 2.59 |
These pathways may be good candidates for policies to reduce inequalities in cancer waiting times.
However, Table 5 shows that these pathways account for only a small proportion of all breaches: the cumulative percentage of all breaches equals 2.59%.
Reducing numbers of breaches
The complementary approach is to improve pathways that account for the largest percentages of all breaches (towards the right of Figure 3).
The pathways with percentages of all breaches in the highest 2.5% of values are:
| Cancer Alliance | Referral group | Cancer type | Percent within standard (%) | Total number of patients | Total number within standard | Total number of breaches | Percent of all breaches (%) | Cumulative percent of all breaches (%) |
|---|---|---|---|---|---|---|---|---|
| West Midlands | Urgent suspected cancer | Urological - prostate | 33.64 | 6252.0 | 2103.0 | 4149.0 | 2.78 | 2.78 |
| East of England | Urgent suspected cancer | Urological - prostate | 53.91 | 7666.0 | 4132.5 | 3533.5 | 2.37 | 5.15 |
| Somerset, Wiltshire, Avon and Gloucestershire | Urgent suspected cancer | Urological - prostate | 42.93 | 3979.0 | 1708.0 | 2271.0 | 1.52 | 6.67 |
| East Midlands | Urgent suspected cancer | Urological - prostate | 51.80 | 4620.5 | 2393.5 | 2227.0 | 1.49 | 8.16 |
| East of England | Urgent suspected cancer | Lower GI | 40.68 | 3261.0 | 1326.5 | 1934.5 | 1.30 | 9.45 |
| East of England | Urgent suspected cancer | Skin | 75.72 | 7053.0 | 5340.5 | 1712.5 | 1.15 | 10.60 |
| Northern | Urgent suspected cancer | Urological - prostate | 56.17 | 3895.0 | 2188.0 | 1707.0 | 1.14 | 11.74 |
| West Midlands | Urgent suspected cancer | Breast | 57.25 | 3961.0 | 2267.5 | 1693.5 | 1.13 | 12.88 |
| Wessex | Urgent suspected cancer | Urological - prostate | 47.82 | 2964.5 | 1417.5 | 1547.0 | 1.04 | 13.91 |
| West Midlands | Urgent suspected cancer | Lower GI | 45.02 | 2686.5 | 1209.5 | 1477.0 | 0.99 | 14.90 |
| East Midlands | Urgent suspected cancer | Lower GI | 35.18 | 2162.0 | 760.5 | 1401.5 | 0.94 | 15.84 |
| East of England | Urgent suspected cancer | Breast | 72.63 | 4851.5 | 3523.5 | 1328.0 | 0.89 | 16.73 |
| West Midlands | Urgent suspected cancer | Skin | 78.69 | 6001.0 | 4722.0 | 1279.0 | 0.86 | 17.59 |
| West Midlands | Consultant upgrade | Lung | 62.43 | 3379.0 | 2109.5 | 1269.5 | 0.85 | 18.44 |
| East Midlands | Urgent suspected cancer | Breast | 60.47 | 3181.0 | 1923.5 | 1257.5 | 0.84 | 19.28 |
| East of England | Consultant upgrade | Lung | 59.12 | 2842.5 | 1680.5 | 1162.0 | 0.78 | 20.06 |
These 16 pathways account for 20.06% of all breaches. Improving these pathways could have a larger impact on overall performance nationally.